April 16, 2024

Trough: MTR

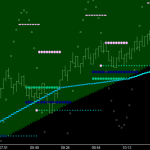
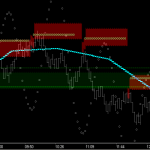
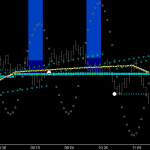
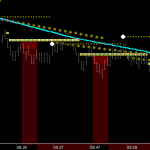
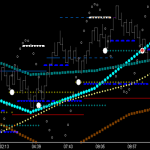
The MTR_Trough dll displays the support levels of the market generated at both the Trough ‘Shock-Point’ and Crest ‘Shock-Point’ of the wave. Directional Bias output is selectable by user, using any Price/Time Fib Fence desired.

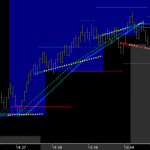
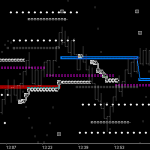
Trough Mechanism: The rising ‘Look-Ahead’s’ (Momentum & Time), of the trough turn, are tracking position relative to the Fib Structure. When the mLkAhd exceeds momentum (trough shock-point), two Fib levels are locked: 1. External, the last Fib level tracked below LkAhds and 2. Internal, the Fib level between mLkAhd and TmLkAhd. The ‘External’ price level becomes a very strong ‘Cup’ of support under the Crest phase of the wave. When broken, this support level becomes resistance. Specifically . . . price movement below is breaking down with dropping momentum . . . a stage set for lower hi’s and lower lo’s.

Trough Thermometer: Cup of the thermometer is the external Fib level described above. The thermometer itself is a count structure, the right side of which is a 21 count from shock-point. The left side is 16 counts from shock-point, ie Time. This ‘count’ zone serves to consistently remind you, as a trader, to monitor what price is doing as it ‘applies’ into the ‘decision point’ 21.

Fib Vectoring: This ’21 External Fib Point’, this ‘Fib_Tm/Pr Decision Point’ is extremely useful as a vector anchor. Users can select whatever Fib level they want to project to, or two auto selection modes are available, either Crest or Trough. When it comes to support/resistance and fences/vectors, it has been found that using the opposing force provides consistent results. So, with this Trough tool, I choose Crest Fib for the auto setting.

Crest: MTR

The MTR_Crest dll displays resistance levels of the market generated at both the Crest ‘Shock-Point’ and Trough ‘Shock-Point’ of the wave. Directional Bias output is selectable by user, using any Price/Time Fib Fence desired.

Crest Mechanism: The dropping ‘Look-Ahead’s’ (Momentum & Time), of the crest turn, are tracking position relative to the Fib Structure. When the mLkAhd exceeds momentum (crest shock-point), two Fib levels are locked: 1. External, the last Fib level tracked above LkAhds and 2. Internal, the Fib level between mLkAhd and TmLkAhd. The ‘External’ price level becomes a very strong ‘Cap’ of resistance over the Trough phase of the wave. When broken, this resistance level becomes support. Specifically . . . price movement above is breaking out with rising momentum . . . a stage set for higher hi’s and higher lo’s.

Crest Thermometer: Cap of the thermometer is the external Fib level described above. The thermometer itself is a count structure, the right side of which is a 21 count from shock-point. The left side is 16 counts from shock-point, ie Time. This ‘count’ zone serves to consistently remind you, as a trader, to monitor what price is doing as it ‘applies’ into the ‘decision point’ 21.

Fib Vectoring: This ’21 External Fib Point’, this ‘Fib_Tm/Pr Decision Point’ is extremely useful as a vector anchor. Users can select whatever Fib level they want to project to, or two auto selection modes are available, either Trough or Crest. When it comes to support/resistance and fences/vectors, it has been found that using the opposing force provides consistent results. So, with this Crest tool, I choose Trough Fib for the auto setting.

Utilities 2: MTR

The MTR_U2 dll is identical to the 1st utilities dll ‘UT’ but offers 3 additional functions:

1. Ability to show two different Fib Levels at the same time, from either force (leg) of the wave. Trough: Target fib level & Support fib level, Crest: Target fib level & Resistance fib level.

2. Directional Bias Fib Fence filtering for the Trough vs Crest Fib Targeting and Support/Resistance Levels.

3. Directional Bias Fib Fence filtering of the Momentum Cap/Cup (including live mLkAhd tracking).

This dll functions as a stand alone trade environment, painting a clear picture of what state price is in. Reward/Risk is easily measured from clearly defined Support/Resistance levels to target Levels/Zones.

Momentum Mechanism: The dropping and rising ‘Look-Ahead’s’ (Crest & Trough), of the wave turns, are tracking a ‘look-ahead’ position relative to the wave structure. When mLkAhd exceeds price (crest and trough shock-points), two mLkAhd levels are known, above and below. These momentum Caps/Cups are very strong resistance/support levels as they extend over the trough and crest phases of the wave. Specifically . . . this shock-point origin (time) is a consistent action point as demonstrated. Output is either user selectable or ‘directionally biased’ automated in this dll.

CrossOver: MTR

The MTR_XOvr dll provides utility functionality (1-3) and stand alone trade structures (4-6):

1. 45* Targeting and 90* Splits (triggered targeting)

2. Trough/Crest Tm Fences

3. Momentum Wave display

4. Friction Vectors from Trough/Crest

5. Time/Price Levels/Zones of the Friction Vectors

6. Tm Fence Fold-Over Levels

IRF: MTR

As you study the logic, look, and feel of each Burton ‘Square Based’ Cycle Tool (detailed under the Support Structures topic), keep in mind the following and understand that it can take quite a bit of observation over time to achieve proficiency:

  1. In general these tools give ‘Big Picture’ confirmation of price’s relative position overall.
  2. Specific tools are typically used on a specific size chart (ie a ‘Legacy’ chart) that is so good it cannot be overlooked.
  3. Some tools are used to give very specific information following very specific events.

The ‘Return Point’ mechanism of the MTR_IRFmmXL dll demonstrates this nicely and is what we call an IRF (Inertial Reference Frame). The IRF levels of each cycle are output in blue/red based on  price’s relationship with the 270* price level of the cycle. This process works exceedingly well for tracking trends as well as reversals, and reversals specifically invoke a reconciliation state, which is a fundamental ‘Law of Vibration’ precept. This cycle tool features both targeting (‘Law of Three’ based), reconciliation level (‘Market Maker’ based), and expansion level tracking (‘Phi’ based). The picture below shows how knowledge of the reconciliation level, ie Return Point, can be used in conjunction with knowledge of price’s momentum position above the Trough Tm Fences.

Consider This . . .

As you study the logic, look, and feel of Support and Resistance Trade Entry associated with Burton ‘Momentum Wave’ Cycle Tools, (detailed in the Help & Study Guide), keep in mind the following features and how you can use them to benefit both your trading and trade entry:

1. Geometry is projected in the future, enabling price/time relationships to be seen well in advance. Successful Trade Entry is based on these relationships.

2. Tools work the same on any size fractal (chart). Both trade entry fractals and directionally biased ‘bigger picture’ fractals used should be chosen with thought given to the vibration rate of the particular market being traded.

3. Most tools provide user selectable directional bias switching . . . . providing clear trade entry levels in sync with market direction.

4. Most tools identify momentum break-out timing points and price levels . . . ie the point of change from buying to selling, etc.

5. ‘Proof-Point’ Relationship Logic is employed in all tools.

6. All tools clearly show what you cannot do. Understanding this is fully half the battle . . . because it mandates patience for opportunity.

Understand that . . .

It is quite difficult to change you . . . the core you . . . all those subtle and some ‘not so subtle’ individual idiosyncrasies that in the end . . . are you. And You . . . are very hard to change. Over the last 6 years of mentoring traders I have found this the most challenging aspect of mentoring and I have come to understand it is better for you to just embrace your personal make-up and trade in sync with yourself.

Ironically . . . by embracing yourself initially . . . change can then come as observation over time will refine your belief system and empower you to change . . . in many ways.

Some examples of how you might apply your personality to your trading:

➢If you see the glass as ‘half-empty’, you will probably do better shorting in a market that has a negative directional bias. You would be best advised to not trade a positive directional bias . . . ie, wait for the change to negative directional bias and trade only shorts. (Do the opposite if you are a ‘glass half-full’ type.)

➢If you are the nervous type and always take profit quickly, then you will do better trading a smaller chart (smaller fractal). You will not do well trading for 5 ticks by looking at a 21-tick range bar chart. This applies to stops also. If you insist on a 5-tick stop . . . you cannot trade a 21-tick chart successfully because time to next valid trade is too long relative to reward. Build your charts according to your ability to hold onto a winner moving to price target.

➢If you don’t do well with relationships . . . Burton Cycle Tools may not be right for you. 🙂

Comprehension . . .

To trade successfully you need 3 things:

1. Knowledge . . . of ‘directional bias’, ‘price targeting’, and the ‘relational price/time components’ which will align and provide clarity to the markets intent.

2. Patience . . . to wait for the alignment of price and time, which gives favorable reward to risk from a specific entry level.

3. Discipline . . . to take the profit or loss the market gives, knowing the next favorable setup is only a matter of time and will be recognizable by you.

While that may sound easy. . . it simply is not. It takes time and it takes not only time, it takes pursuit of the correct approach over time. That approach, I believe, specifically mandates that you study . . . to the point of understanding . . . the nature of the markets. That core nature being one of ‘Opposing Forces’.

Your ‘Stages of Comprehension’ should come in this order:

1. Focus of Intent . . . price action consistently creates targeted price levels supported by current directional bias.

2. Threshold of the Opposing Force . . . vibrational truth produces retracement moves to the relevant support/resistance levels of the cycle.

3. Point of Proof Alignment . . . time both facilitates and is established by the alignment of price and the price/time structure across fractals, a necessary component for continuance.

4. Momentum . . . at time, will uphold or cross the point of proof established by the retracement, thus confirming the move to target (ie, time is now)

5. Trade Entries . . . in this zone of retracement, provide for max reward with minimum risk which will build consistent profit over time. Each of the above are consistent and reoccurring phenomena of the markets. Mastering your recognition, understanding, and implementation of each is your objective. My experience can tell you that numbers 1, 2 and 4 come readily with observation, while items 3 and 5 take serious work. Yes it is not easy . . . but it is a journey well worth the undertaking . . . and necessary as you pursue the goal of trading for success each day. If you are already successful with your present approach to trading it is very important that any price/time component (ie, layer of information) added to your current method be fully understood and integrated over time. Many BTS tools deal specifically with directional bias and it is anticipated that they will facilitate increased success when added to any system.   In this help file you will find many of my own perspectives detailed . . . but in the end . . . following your observation of and experience with Burton Cycle Tools . . . you will make it your own.

Tale of the Tape . . .

Price spends the majority of it’s time bracketed by the wave of vibration. In it’s journey through the wave, price is projecting a map of the future, creating a story line if you will (the ‘Tale of the Tape’), that predicts where the significant events of the future will occur. For you to trade successfully in real-time, it is necessary for you to internalize the significant ‘event’ components of this map, so you can read the story of price (the ‘tape’) to yourself, as it unfolds. You must become a ‘Tape-Reader’. Developing the ability to read this map/story is a building block process. The 1st building block is the Fold-Over Point (Level) of the Time Fence.


& Study Guide . . .

Getting started with anything new is always difficult. Success with understanding must be built one step at a time. Follow the concepts outlined in each section of this Help & Study Guide (top to bottom) to build both knowledge and comprehension. When you are ready, download and install the cycle tool trials that speak to you, and set up the sample charts as instructed. Confidence will only come as you observe market vibration at work each day and apply the knowledge you’ve gained through study.

Help & Study Guide Links:

. . . Introduction

. . . Overview

. . . Trading and You

. . . Trading for Success

. . . Cycle Tools-Tape Readers

. . . Trading Examples