1st Charts

Contents
Getting started with anything new is always difficult. As previously mentioned, success with understanding must be built one step at a time. Follow the procedures outlined in this section to build confidence as you observe market vibration at work each day.
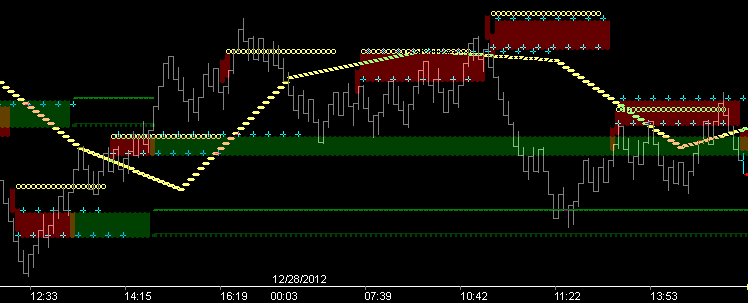
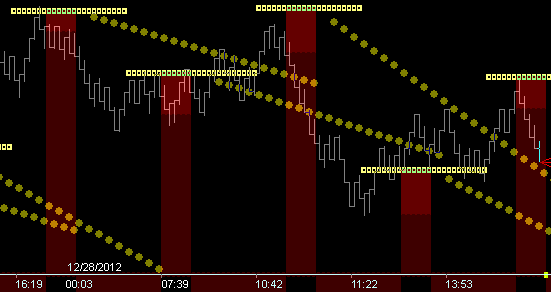
The MTR_U2 dll can show either side of the Wave force (Crest or Trough) and is recommended as a good starting point for most. It is suggested that you set up two charts for any tool which can show either side of the wave. The 1st chart will display price's position relative to the Crest force while the 2nd chart will display price's position relative to the Trough force. This two chart approach will serve to re-enforce in you (over time) the duality of each side of the wave. The goal is to understand which side is ruling (ie. in control), and then trade accordingly as opportunity for trade entry presents itself. The video below gives good example of a chart showing only the Trough side of the MTR_U2 dll.
![]() Trading the Wave . . . Where's my target? . . . Where's my stop?
Trading the Wave . . . Where's my target? . . . Where's my stop?
Watch this video for a look at Trough (generated) Fib_21 Level, Fib_21 Fence (ie Time/Price_21 support) Trading w/Fib_8 Targeting
|

| Prep: Follow the steps under Chart/Symbol Setup and Dll Installation when you are ready to observe in real-time on your own charts. |
Side Selectable Wave Tools |
Single sided Wave Tools |
Non-Selectable Wave Tools |
•MTR_U2 •MTR_UT •MTR_AUTO •MTR_XOvr |
•MTR_Trough •MTR_Crest •MTR_gBmprP •MTR_gBmprN |
•MTR_IRFmmXL •MTR_mSqrXL |
The charts I use are 3, 5, 8, 13, 17 and 21 range bar tick charts. The size chosen varies based on volume of particular markets. Tools work the same on any size fractal (chart). Both trade-entry fractals and dBias 'bigger picture' fractals used should be chosen with thought given to the vibration rate of the particular market being traded.
During a typical week (5 days of trading) the Crude Oil fractal_8 chart has 127 cycles. That means 127 cycles, exhibiting the same vibrational truths, provide repetitive trade opportunities.
During the same 5 days the Euro fractal_8 chart has only 24 cycles. That means 5 times fewer trade opportunities. It also means that any stop taken has a much longer real-time waiting period to the next qualified trade entry, ie opportunity for recovery, which is extremely important to successful trading. A 4-tick chart has 105 cycles and provides a much better 'time-to-recovery' factor. [5-tick is generally 66 cycles while 3-tick is 192 cycles] However, the caveat to this is that you must adjust profit expectations accordingly. A smaller fractal will have fewer ticks to target, etc.
The Dow fractal_8 chart typically has 48 cycles and the ES fractal_8 chart typically has 128 cycles (but is a special case).
Fast moving markets are much easier to trade, providing greater reward and quicker opportunity for recovery.
So . . . trade-entry charts should be sized to provide enough cycles/day that the pulsing of price through the vibrational structure can: 1)be taken advantage of with consistency (in sync with larger fractal directional bias) 2)demonstrate clear directional bias (in sync with larger fractals) and 3)provide enough cycle rotations (information) to allow for recovery (from a stop-loss exit) at the next cycles time/price entry levels
Summary: Slower moving markets dictate smaller fractals for entry . . . trade a market with clear directional bias on a larger fractal . . . taking entries from smaller fractals as they line-up and agree with the bigger fractal picture. |
|
|
|

I much prefer to trade faster moving markets like commodities.
|