BTS9_MTR_UT

Contents
Momentum Tape Reader Utilities (click pics to study)
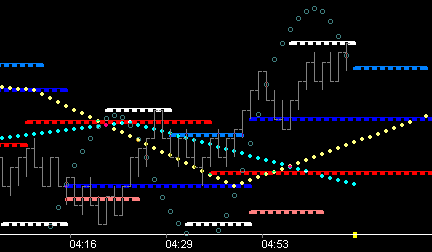
[showing: Standard '3' wave with both Trough/Crest Fib_0 Levels
[showing: Price below Fib_0 (top left of pick, bottom of wave white_red) is extremely negative. Price above Fib_0 (top of wave white_blue) is extremely positive. A standard Crest Fib Fence is Fib13_Tm21. Because the core wave length has a fundamental duration of 26, Fib13 functions nicely as a proxy for midpoint, and Tm21 functions consistently as an apply time into next cycle. Price below this fence and rising is retracing into resistance . . . price above this fence and falling is retracing into support.]
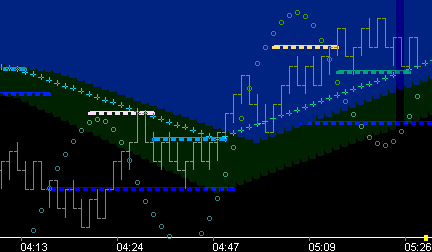
[showing: The same concept is easily applied for the opposing force, Trough Resistance. On the resistance side the Trough Fib17_Tm21 fence is used (cyan). Fold-Over is at Fib_17 level (red) and is showing from Tm0. Study these two charts to see and understand the interplay of these key levels. Note: time ~4:35, price is tunneling thru the two red 17 levels, breaking out of the Trough Resistance.]
[showing: Both views can be combined if desired. Notice the colored zones shown (above key Fib fence/below key Fib fence) adds correct emphasis to the 'state' transition, adding clarity to what you should be thinking, at the right time.]
Tm90 Vectors
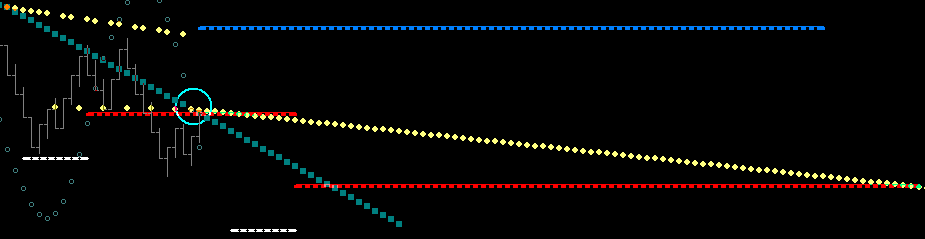
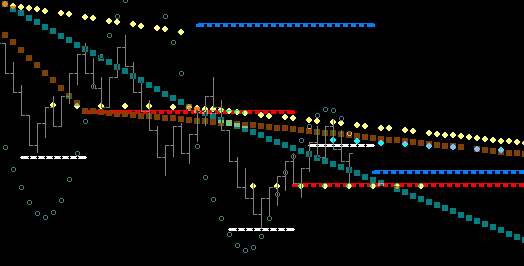
[showing: Negative breakdown thru Tm90 vector intersection (circled upper left corner of pic) with subsequent downside follow-thru being capped by negative 90 vectoring for the next 17 hours. Details of this vectoring feature can be found to the right under "Pr/Tm Target Vectoring & FishTails". Details there describe the vectoring process featuring the price action found in the red circled area in the above pic. Right up to the 'threshold point' (cyan circle) in lower right of pic.]
|
The MTR_UT dll functions as a wave support dll, providing a fast, yet complete, source for numerous structural components to be displayed as desired. It also can easily function as a stand alone trade environment, painting a clear picture of what state price is in. Because of this, it is a good source dll to play with and study as you get familiar with Fib Fences, Fib Levels & Targeting, Fold-Over Levels, Fib GateWay Break-Outs, Tm Fences, and Pr/Tm Target Vectoring & FishTails (Lead-Ins).
Wave Mechanism: When the rising mLkAhd of the trough turn exceeds price (the trough shock-point), the Fib_0 level is displayed as resistance/target zone across the Crest phase of the wave. When the falling mLkAhd of the crest turn exceeds price (the crest shock-point), the Fib_0 level is displayed as support/target zone across the Trough phase of the wave.
Fib Fence Mechanism: The momentum shock-points create LkAhd differential vectoring, thus generating a Fib structure in terms of both price and time. Marking FibLv13@Tm21 from one cycle to the next creates a vector (or Fib Fence) that tracks whether the FibLv13 is rising or falling, and shows whether price is above or below this fence. The opening in the fence marks the rotation point (ie Tm21, ie the PrTm anchor point) for the projection of the fence in the next cycle. Essentially this 'Fold-Over' level is the base of a Fib-Square, and can be shown.
Fib_8 Targeting: Part of the self-generating aspect of the wave is that price is consistently finding its way to the Fib_8 level of the opposing forces. Note: Typically Fib_5 on a smaller fractal such as a 3 or 5 tick chart. Because of this, targeting these levels works exceptionally well when your directional bias criteria is met. Both Fib Fences and Fib Fold-Over Levels can be constructed to provide max reward/min risk opportunities as demonstrated in these charts.
Fib GateWay Break-Outs: Price moving beyond the Fib_8, Fib_5, Fib_0 level, is breaking out to higher or lower targeting, but you need entry. Fib Fences can be used to highlight or define this break-out zone in a variety of ways.
Tm Fences (from trough/crest friction vectors): Any combination of standard Tm fences can be output using this dll. Much has been written elsewhere regarding standard structures such as 13,17; 17,21; 21,26; 26,34; etc, and trough vs crest.
Study the above 34 Tm Fences in conjunction with the other charts and note their significant contribution to the picture of prices position.
Pr/Tm Target Vectoring & FishTails: Since price has an extreme predilection to accomplish the Fib_8 levels, it should follow that a vectoring mechanism should exist that points a path to that level. We also know that the fold-over level of fences are essentially the Base and Top of Squares. So . . . might it not be useful to project form that 'horizontal' (base/top level) towards the target level at some 'relevant' time point, say . . . 72, 81, or 90. Doing that can provide a unique perspective as price applies into a change point, ie helping you read the story of price action.
Crest shock-point outputs Fib structure. Price below Trough Fence generates negative 'cap' vector from Fence fold-over (circle 1) to Tm90 (circle 2). Price pushes down past Fib_8 target level and holds above Fib_0 level.
Trough turn generates 2nd vector (fishtail), thru the new Fence fold-over (circled), to the same Tm90.
Price action should remain capped by this vector until it is not, ie price is supported by either positive vector or fishtail. At next shock point new vector comes on and process repeats.
Price is held by 90 vector and moves on down to Fib_8, held by Fib_0, moves above new fishtail and rises up to crest fence threshold just in time to put on the opposing force fishtail, pointing to Tm90 of the blue target, and price drops right to target.
Price is now above the negative fishtail and has moved right to the new negative 90 vector after having generated the 1st positive fishtail since this negative trend began . . . 17 hours earlier (see 'Tm90 Vectors' chart at left). In essence this is decision time. Price would have to move above fishtail (cyan) and crest fence in order to put on a positive Tm90 vector. Recognize this potential as it is happening and you are on the winning side of momentum. |


 is extremely negative. Price above Fib_0 (top of wave white_blue) is extremely positive. A standard Crest Fib Fence is Fib13_Tm21. Because the core wave length has a fundamental duration of 26, Fib13 functions nicely as a proxy for midpoint, and Tm21 functions consistently as an apply time into next cycle. Price below this fence and rising is retracing into resistance . . . price above this fence and falling is retracing into support.")
 when price is in the negative space (below Crest Fib13_Tm21 Fence), and (lighter blue) Fib_5 targeting when price is in the positive space above this fence. Note: the 'Fold-Over' level of the fence can be both 1. displayed at fold-over level (dark blue) and 2. the start Time of this level can be shifted as desired; shown is Tm8. Note that Trough Tm8 is generally very close to the Crest of Wave turn and notice this 'Tm8' was key in the downside move at ~4:00 and the upside move at ~4:22.")

. Fold-Over is at Fib_17 level (red) and is showing from Tm0. Study these two charts to see and understand the interplay of these key levels. Note: time ~4:35, price is tunneling thru the two red 17 levels, breaking out of the Trough Resistance.")
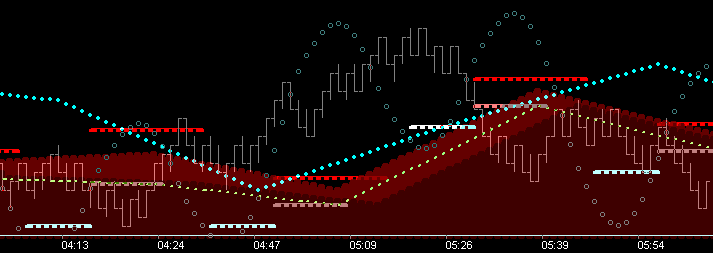
 adds correct emphasis to the 'state' transition, adding clarity to what you should be thinking, at the right time.")
 with subsequent downside follow-thru being capped by negative 90 vectoring for the next 17 hours. Details of this vectoring feature can be found to the right under \"Pr/Tm Target Vectoring & FishTails\". Details there describe the vectoring process featuring the price action found in the red circled area in the above pic. Right up to the 'threshold point' (cyan circle) in lower right of pic.")


")


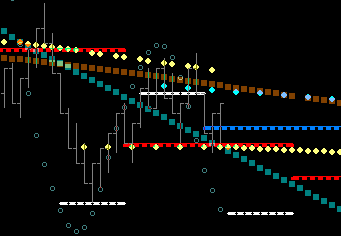
[showing: Continuance up into two more cycles, maintaining position above Tm90's. Note top of momentum wave/Fib_0 level holding price is common. Price held up by 9:05 fishtail, falls thru next 90 origin at 10:36 staying above previous 90 finding support at Fib_8 level (red) as it apply's into next fishtail at 11:35. The move below the trough fence however, sets up the potential for the negative Tm90 vector which shows up at the double top. Now price is caught in this flag, this bracket. Your thought is: decision will be made as price approaches the intersection of these two opposing forces . . .]
|
[showing: Move above Trough fence was break above previous days 90 shown at left in pic.
[showing: At 2:12 price breaks out and runs til the next fishtail cap point at 8:34.]
|
 as it apply's into next fishtail at 11:35. The move below the trough fence however, sets up the potential for the negative Tm90 vector which shows up at the double top. Now price is caught in this flag, this bracket. Your thought is: decision will be made as price approaches the intersection of these two opposing forces . . .")


, instead of Tm fences.")
The MTR_UT dll can be set to display the following Support/Resistance features of the Burton Momentum Wave:
1.Option to display Fib Fences: Trough, Crest or both
2.Option to display Fib Levels (Targeting or Fold-Over): Trough, Crest or both
3.Option to display Tm Fence Fold-Over Levels: Trough, Crest or both (w/dBias options)
4.Option to display Fib Break-Out levels as Fences or Highlighted Zones: Trough, Crest or both
5.Option to display Time Fences: Trough, Crest or both
6.Option to display Target Level Time Vectoring w/FishTails: Trough, Crest or both
7.Option to apply user selected Fib Price/Time Fence dBias Filtering to #6 output (shown in examples)
8.Option to show Tm Markers along FishTails (13, 17, 21, 34)
9.Option to show Tm Markers along Fib Fences (17, 21, 34)
10. Option to display Momentum Bracketing, Sup/Res Caps & Cups: Trough, Crest, or both
11. Option to display the Momentum Wave
Remember This Fundamental of Learning: |
Each of the vibrational components of this Wave Based tool provide a unique 'Squared' and 'Phi Rich' structure to any chart. Successful trading comes when two things are understood:
1.The structural RELATIONSHIP of the above features (specifically created by price action) and . . . 2. Price's position in 'Relation' to this 'RELATIONSHIP'
It is suggested and highly recommended that users add only one structure and concept to their trading at a time. Complete clarity of the trade precepts (action points) of each must be understood and internalized before a 2nd can be added successfully.
Observe . . . find what you like . . . observe . . . what speaks to you . . . observe . . . make it your own . . . use it.
This help file is about helping you accomplish that . . . review these charts often.
|
Learn More: