A quick reference guide to terms used throughout this tutorial:
Entry
Description
Subject
POP$
'Position of Price' refers to Burton Cycle Tools 'Momentum Wave' structure as a 'Tape Reader' mechanism which identifies where price is, at all times. Knowledge of prices 'position' allows traders to trade with full knowledge of such key information as current reward to risk, correct direction to trade, time to trade for price to make a reaction move, etc.
mSqrXL
'Momentum Square XPansion Level'. One of many Burton Cycle Tool dlls (i.e. indicators). This dll features:
1.Natural Square arcs projected from both Trough and Crest of the Burton Momentum Wave
2.XPansion targeting (Trough/Crest)
3.Time Fence (Trough/Crest)
4.Wave Sacred Cut Time/Price
5.Break-Out Trajectory Vectors from time (directional bias support/resistance)
mWav_TrdFltr
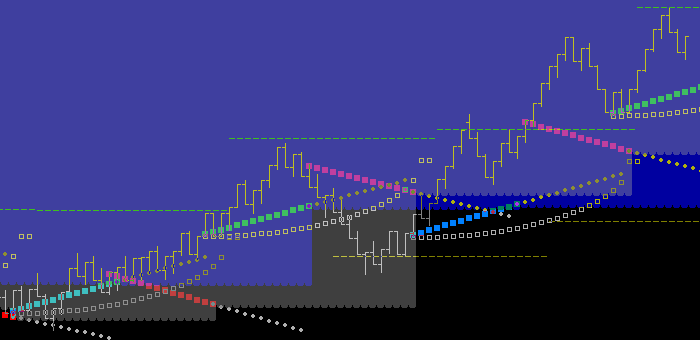
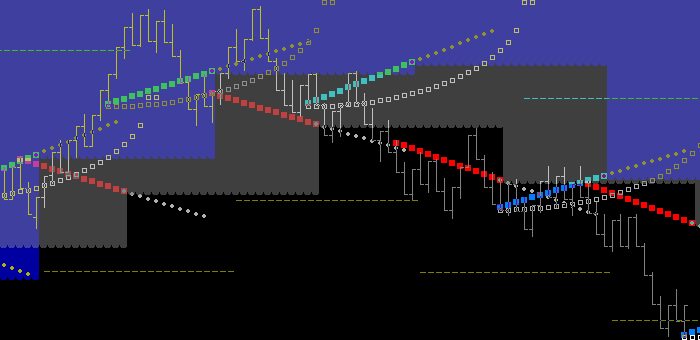
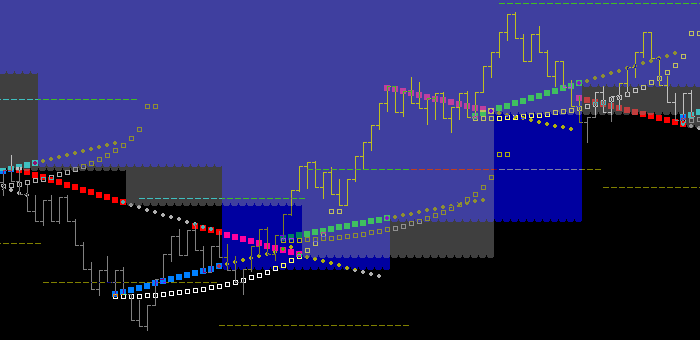
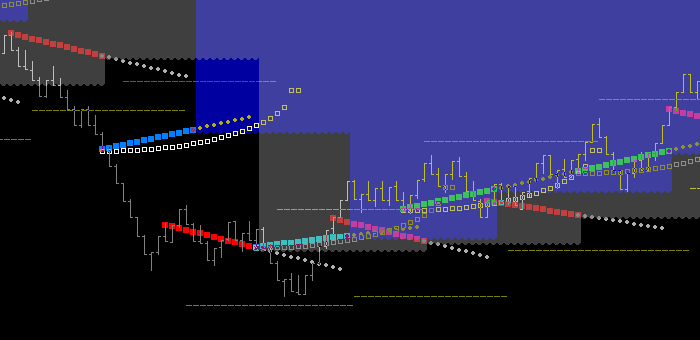
'Momentum Wave Trade Filter'. This dll can output Friction Vectors, xPansion Levels, Time Fences, and Sacred Cut Levels. However, the primary feature of this dll is momentum based directional bias output to the screen in the form of sup/res price level and the time marker for end of such sup/res. Specifically it is marking the selected time/price level (chosen by the user), as a colored zone which price is either in, or it is not. Tm13 is a standard threshold suggested for use. It should be used for filtering any trade set-up, in any market, using any indicator. Crest levels of 'Time' support are colored grey. Trough levels of 'Time' support are colored dark blue. Overlapping 'Time' support of both Crest and Trough produces a lighter blue zone. Price in these colored zones is either making higher lo's, or poised to do so. Price not in these zones is not. These zones are output in the future as soon as a new Crest or Trough is put in. Thus it is extremely significant to observe price action as it applies into the threshold of Time. For instance; knowing the price level of support in the future, provides ample opportunity to compare prices position in other fractals.
dll
'Dynamic Link Library'. A dll is a set of executable instructions (i.e.program) that specifically run inside another program. Burton Cycle Tools are dlls that run inside of Fibonacci Trader as indicators featuring vibrational geometric structure.
precept
A command or principle intended especially as a general rule of action.
Burton Momentum Wave
A unique wave-form by Trace Burton. Characteristics include a price/time self-generating wave which reveals time origin . . . and thus by definition . . . produces a 'phi-rich' trading environment.
Burton Cycle Tools
Tape Reader
Investing technique used by some traders to analyze the price and volume of a particular market to identify trends in trading behavior. The term gets its name from the old method of displaying bid and ask information on paper printed by ticker tape machines. Traders read the tape numbers to create an unemotional analysis looking to capitalize on the behavior of the market.
Threshold
The point at which a stimulus is of sufficient intensity to begin to produce an effect. Synonym: [verge] . . . transitional interval beyond which some new action or different state is likely to begin.
Tm13
'Time 13' is 13 bars from origin along the friction vector trajectory. Because the market vibrational wave length is 26, this makes Tm13 the midpoint (trough to trough, crest to crest) and thus significant. i.e. What is price doing at midpoint? It is an important threshold of decision for all the reasons explained in this help file.
Friction Vector
Time Fence
SwtSptZn
'Sweet Spot Zone'. The friction zone of the damping wave where price has penetrated the wave leg (either up or down) and is slowing into the wave crest or trough turning point. Specifically it is the .9, .707, .666, .618, .583, and .5 friction points of the damping wave.