MTR_XOvr Parameters

Contents
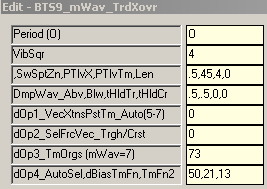
6 switches control actual output to the chart:
Parameter 3, Field 2 . . . Targeting Price/Time Square Level
Parameter 3, Field 4 . . . Display Square Level Zone to this Length
Parameter 5, Field 1 . . . Allow Friction Vector Output + Auto
Parameter 6, Field 1 . . . Trough/Crest Vector Selection
Parameter 7, Field 1 . . . Momentum Wave
Parameter 8, Field 1 . . . Time Fence/Sacred Cut Selection
These switches can be used individually and/or combined to make the chart suit your individual trade style.
Multiple dlls can be placed on a chart with different settings to create the trade structure and clarity desired.
(i.e. line style, color, symbol, sizing, etc.)
If all 6 of the above switches are set to zero (0), there is no output to the chart.
All other switches set the math and decision logic that is used internally in the dll to create the structure desired. Details of all options for all switches are found below.
Field 1: Fibonacci Trader's 'Own period
(Burton Cycle Tools use only the 'Own' period)
|
Options:
Field 1: Square of 9 Vibration_Momentum Wave
(Sqr9Vib is added to the root of the square of the range of the chart bar then re-squared)
Options: -6 to 6
Example: 9 tick range bar chart. [9^ = 81, 9 + 3 = 12, 12^ = 144] So on a 9 tick range bar chart a 3 yields a Sqr12 momentum wave on a Sqr9 chart. A 13 tick range bar chart would have a Sqr16 momentum wave on a Sqr13 chart.
Notes: This process yields the vibrational momentum wave of the chart as a function of incremental 180* units +/- the square of the range of the chart. [It should also be noted that consistent throughout Burton Cycle Tools the concept of 3 and 270* carry the same meaning. In general . . . the decision is whether to use a 3 or a 4 setting.
|
Options:
Field 1: Sweet Spot Zone (Time)
(One damping wave level below the .9 friction point embodies the Sacred Cut fractional point of .707, which in a vibrational context manifests as a significant 'Time Origin'. Zone here refers to this 2nd friction point on to the .5 point (Midpoint). These damping wave levels then embrace the friction range including .707, .666, .618, .583 and .5 . . . all referred to as the 'Sweet Spot Zone'.
Options: Suggest using the default .5 in this dll
Field 2: Price/Time Level Target
What horizontal level 'Time/Price Square' do you want to use for targeting? Default = 45 Note: whatever is chosen the Split Level Target is double. So 45 produces 90 as the split target (and is very good) (I also use 52 or 54 on some markets and smaller charts, making the split be 104-108)
Field 3: Price/Time Level Time
What horizontal level 'Time/Price Square' (Start Point) do you want to use for Support/Resistance Zone display? 3,5,8,13,17,21 are typical (Note: 4 is used extensively and captures directional vibration nicely)
Field 4: Zone Length (Output)
What Length or 'End Point' do you want use for the zones? Options: 0 = Turns Zone display Off 34 = Default
|
Options:
Field 1: Damping Wave Above (Falling)
(This setting controls the decline rate of the damping wave as well as the finished midpoint level at midpoint time (Wave Trough). Understand that a setting of .5 yields midpoint price at midpoint time.)
Field 2: Damping Wave Below (Rising)
(This setting controls the advance rate of the damping wave as well as the finished midpoint level at midpoint time (Wave Crest). Understand that a setting of .5 yields midpoint price at midpoint time.)
Options: The .5 damping wave is a powerful tool in defining COP$ (Condition Of Price) consistently. Almost all examples will use this setting exclusively. However, many significant structures can be tweaked by altering the damping wave, based on thorough understanding, personal preference and back-testing. Both .333 and .666 waves are very good for instance, but consistency is the key. Looking at one 'tweaked' structure while others are standard .5 can be quite difficult and may take extreme focus.
Field 3: Time Threshold Trough
At what Time/Price point do you want to start display of the Trough Friction Vector?
Options: Can be any number less than Parameter 3, Field 3 Default = 0
Field 4: Time Threshold Crest
At what Time/Price point do you want to start display of the Crest Friction Vector?
Options: Can be any number less than Parameter 3, Field 3 Default = 0
|
Options:
Field 1: Select Manual vs Auto Vectoring
Options: 0 = Off 1 = Allow Trough Display (Parameter 6, Field 1) 11 = Same as 1 + Vector extensions 2 = Allow Crest Display (Parameter 6, Field 1) 21 = Same as 2 + Vector extensions 3 = Allow Trough/Crest Display (Parameter 6, Field 1) 31 = Same as 3 + Vector extensions 5 = Auto 51 = Auto with Vector extensions 7 = Auto show directional Change Origin Vector only 8 = Auto show directional Change Origin Horizontal Level only
|
Options:
Field 1: Show Friction Vectors and Trough Support or Resistance
Options: 0 = Off 1 = Show Trough 2 = Show Crest 3 = Show Both
|
Options:
Field 1: Targeting_Momentum Wave
Options: 0 = Off 1 = Show [+] Target Splits 2 = Show [-] Target Splits 3 = Show Target Splits 7 = Show Momentum Wave Adding 7 in the 1st digit outputs momentum wave Ex. 73 = Same as 3 + Show Wave
|
Options:
Field 1: Select Time Fence/Sacred Cut (Output)
Parameter 5, Field 1 (Auto Settings 5-8) uses the 2 levels selected below for filtering directional bias. Otherwise these settings are stand alone and can be used in utility fashion to output fences and Sacred Cut levels to any chart.
Options: 4 = Sets Trough fences as directional bias for Auto settings (no fence display) 40 = Show double Trough fences (Field 2, 3 settings) 42 = Show Sacred Cut (using w/Trough fence in Auto) 420 = Show Sacred Cut and double Trough fences 421 = Show Sacred Cut and Trough Tm fence 1 422 = Show Sacred Cut and Trough Tm fence 2 45 = Show single Trough and single Crest fence 54 = Same as 45 but (reverses Field 2 & 3) 5 = Sets Crest fences as directional bias for Auto settings (no fence display) 50 = Show double Crest fences (Field 2, 3 settings) 52 = Show Sacred Cut (using w/Crest fence in Auto) 520 = Show double Crest fences and Sacred Cut 521 = Show Sacred Cut and Crest Tm fence 1 522 = Show Sacred Cut and Crest Tm fence 2 1 = 270 Sacred Cut 2 = Sacred Cut (Note: all time fences use Lines #8 & #9)
Field 2: Fence 1 (Time Threshold)
(From what Time Count along the Friction Vector from the Trough/Crest do you want to construct Time Fence #1?) Default = 17 (Note: 13 is a standard since it is midpoint and provides clarity to price action, relative to midpoint, from cycle to cycle) (Times: 17, 21, 26, 34 are significant as fences) (Larger Times: 45 is extremely significant, 52, 72, 90 can be interesting)
Field 3: Fence 2 (Time Threshold)
(From what Time Count along the Friction Vector from the Trough/Crest do you want to construct Time Fence #2?) Default = 34 (Note: 13 is a standard since it is midpoint and provides clarity to price action, relative to midpoint, from cycle to cycle) (Times: 17, 21, 26, 34 are significant as fences) (Larger Times: 45 is extremely significant, 52, 72, 90 can be interesting)
|