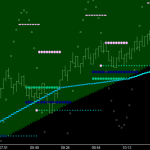
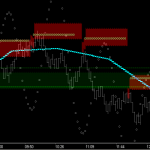
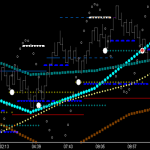
My preferred setting for the Master Square output shows the Sacred Cut fractal of the square. As you can see above . . . the full square (cycle) is depicted, but the 1×1’s and chordal deviation arc show the 707 fractal. The 707 fractal of a cycle has many unique relationships with the ‘whole’ cycle. One primary truth or tenet of a Master Square is that almost any strong move to ET level of the cycle will be held (or find support) with the arc of the 707 (Note: the 270* arc (750) also works well). In the dual cycle stair step shown in the chart above you can see price moving strongly to top of square in both cycles . . . AND . . . in both cases the retracement finds price moving back down to ET at ET time of the Master Square. This is depicted below with the dll indicator setting changed to show the full master square 1×1’s and arc. Study both for comparison.

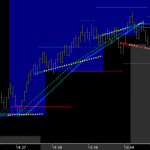
In real-time (shown below) . . . with the 707 fractal showing . . . the future (chart space in front of current price bar) shows the full Master Square 1×1’s so it is easy to see where price is at in the full square relationship, and how it is reacting to support levels of the cycle. In the vast majority of my posts you will see this 707 fractal structure displayed this way. This mSqr tool allows you to set any fractal you want to watch . . . 333, 500, 666, 1.666 etc.

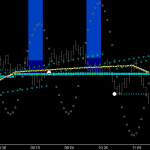
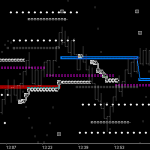
Note: Price stepping into the new cycle ‘phase space’ above the top of square is halting precisely at ET of the ‘Octave Square’. This is a very predictable high here because effectively at that point in time of the cycle, price is positioned right on a 10/1 vector run rate and not very likely to continue higher . . . at that time (ie. price is way ahead of time).