April 20, 2024

Auto 45’s . . .

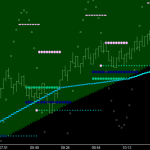
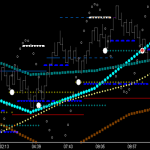
The 45 Time/Price levels (displayed as zones using the Auto Momentum Tape Reader tool), provide consistent price position feedback to the trader. Specifically . . . continuance vs bracketing versus break-out potential/time. The picture above is painted quite clearly as price applies into 1st: key Fib fence (vector) crossover potential, 5:18 forward, and 2nd: key trough resistance break-out potential, from fence crossing forward. This 2nd point is crucial to tape reading. The reason this potential resistance break will be key to break-out is because this price level was previously broken above. The green zone that is running parallel and below the current red zone tells you that earlier in the day, buying occurred at this price level . . . enough buying that a break-out above the red resistance level occurred, which consequently turned into this running support level . . . the green zone. This green zone then represents the last reversal support zone and is going to keep running until a new reversal support zone occurs . . . a new green. So as price applies into this red reversal potential the trader knows that this is a level where the market had support previously, and if a resistance break occurs here, a new support zone green will be generated, confirming that market support still exists at this price level, ie the perfect proof-point level. When/if this occurs, the 3rd marker (green lines) will drop to mark this significant event as a 270* support zone, and it will remain support until it is not. This pic should be studied thoroughly as it reveals the exact mechanism that successful tape reading is all about, ie natural law support/resistance levels broken become resistance/support levels of the future. Tracking those levels and trading accordingly, with stops as shown, places your trade entry on the correct side of market momentum.

Fib Level Targeting . . .

Price above key Fib Fence and key Fib Level is in a position to expand to the upside. As price steps through cycles, the Fib targeting levels will continue to be completed as long as price remains above the key Fib fence.  Setting an upper ‘Break-Out’ zone Fib fence to a colored zone can communicate clearly that price is advancing in an extreme break-out zone, ie higher hi’s, higher lo’s and the wave is rising.

Crest Thermometer Caps . . .

Crest Caps, Fib Vectors and the 21 Count are dominant forces even outside the realm of Fib Fence directional bias. Always ask yourself . . . What is price doing as it applies into the 21 count (right side of the thermometer). The cap level functions as a proof-point break-out level . . . so what is the relationship with other proof-point levels at 21 count time? (ie Fib Fence, Fib Levels, Vectors, Time Fence, etc.) Is price applying or consolidating into this cap level at time? Have upside targets been triggered? Is price at break-out approach above the previous cycle’s vectors? (brown dots) Understand that failure to break-out puts price in a position to get capped by the upcoming vector . . . which will appear at wave shock-point. So either it gets trapped, or it launches higher. Take advantage of that knowledge as set-ups occur repeatedly.

Master Square_1

My preferred setting for the Master Square output shows the Sacred Cut fractal of the square. As you can see above . . . the full square (cycle) is depicted, but the 1×1’s and chordal deviation arc show the 707 fractal.  The 707 fractal of a cycle has many unique relationships with the ‘whole’ cycle. One primary truth or tenet of a Master Square is that almost any strong move to ET level of the cycle will be held (or find support) with the arc of the 707 (Note: the 270* arc (750) also works well).  In the dual cycle stair step shown in the chart above you can see price moving strongly to top of square in both cycles . . . AND . . . in both cases the retracement finds price moving back down to ET at ET time of the Master Square. This is depicted below with the dll indicator setting changed to show the full master square 1×1’s and arc. Study both for comparison.

In real-time (shown below) . . . with the 707 fractal showing . . . the future (chart space in front of current price bar) shows the full Master Square 1×1’s so it is easy to see where price is at in the full square relationship, and how it is reacting to support levels of the cycle. In the vast majority of my posts you will see this 707 fractal structure displayed this way. This mSqr tool allows you to set any fractal you want to watch . . . 333, 500, 666, 1.666 etc.

Note: Price stepping into the new cycle ‘phase space’ above the top of square is halting precisely at ET of the ‘Octave Square’. This is a very predictable high here because effectively at that point in time of the cycle, price is positioned right on a 10/1 vector run rate and not very likely to continue higher . . . at that time (ie. price is way ahead of time).