April 19, 2024

Utilities: MTR

The MTR_UT dll functions as a wave support dll providing a fast and complete source for many structural components to be displayed as desired. It also can easily function as a stand alone trade environment, painting a clear picture of what state price is in. Because of this, it is a good source dll to play with and study as you get familiar with Fib Fences, Fib Levels & Targeting, Fold-Over Levels, Fib GateWay Break-Outs, Tm Fences, and Pr/Tm Target Vectoring & FishTails (Lead-Ins).

Wave Mechanism: When the rising mLkAhd of the trough turn exceeds price (the trough shock-point), the Fib_0 level is displayed as resistance/target zone across the Crest phase of the wave. When the falling mLkAhd of the crest turn exceeds price (the crest shock-point), the Fib_0 level is displayed as support/target zone across the Trough phase of the wave.

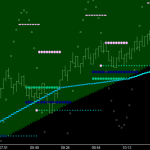
Fib Fence Mechanism: The momentum shock-points create LkAhd differential vectoring, thus generating a Fib structure in terms of both price and time. Marking FibLv13@Tm21 from one cycle to the next creates a vector (or Fib Fence) that tracks whether the FibLv13 is rising or falling, and shows whether price is above or below this fence. The opening in the fence marks the rotation point (ie Tm21, ie the PrTm anchor point) for the projection of the fence in the next cycle. Essentially this ‘Fold-Over’ level is the base of a Fib-Square, and can be shown.

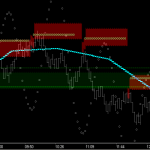
Fib_8 Targeting: Part of the self-generating aspect of the wave is that price is consistently finding its way to the Fib_8 level of the opposing forces. Note: Because of this, targeting these levels works exceptionally well when your directional bias criteria is met. Both Fib Fences and Fib Fold-Over Levels can be constructed to provide max reward/min risk opportunities as demonstrated in these charts.

Fib GateWay Break-Outs: Price moving beyond the Fib_8, Fib_5, Fib_0 level, is breaking out to higher or lower targeting, but you need entry. Fib Fences can be used to highlight or define this break-out zone in a variety of ways.

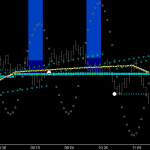
Tm Fences (from trough/crest friction vectors): Any combination of standard Tm fences can be output using this dll. Much has been written elsewhere regarding standard structures such as 13,17; 17,21; 21,26; 26,34; etc, and trough vs crest.

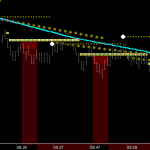
Pr/Tm Target Vectoring & FishTails:  Since price has an extreme predilection to accomplish the Fib_8 levels, it should follow that a vectoring mechanism should exist that points a path to that level. We also know that the fold-over level of fences are essentially the Base and Top of Squares. So . . . might it not be useful to project form that ‘horizontal’ (base/top level) towards the target level at some ‘relevant’ time point, say . . . 72, 81, or 90. Doing that can provide a unique perspective as price applies into a change point, ie helping you read the story of price action.

Auto: MTR

The MTR_AUTO dll displays resistance and support zones of the market at each wave turn. Directional Bias output is selectable by user, using any Price/Time Fib Fence desired.

Trough Mechanism: When broken, the resistance zone becomes support. These reversal zone bandwidths consistently define the bracketing levels of future price action, setting the stage for clearly defined retracements to breakout levels.

Crest Mechanism: When broken, the support zone becomes resistance. A market (as pictured) that is merely retracing into prior support reversal zones, is trending down.


Trough: MTR

The MTR_Trough dll displays the support levels of the market generated at both the Trough ‘Shock-Point’ and Crest ‘Shock-Point’ of the wave. Directional Bias output is selectable by user, using any Price/Time Fib Fence desired.

Trough Mechanism: The rising ‘Look-Ahead’s’ (Momentum & Time), of the trough turn, are tracking position relative to the Fib Structure. When the mLkAhd exceeds momentum (trough shock-point), two Fib levels are locked: 1. External, the last Fib level tracked below LkAhds and 2. Internal, the Fib level between mLkAhd and TmLkAhd. The ‘External’ price level becomes a very strong ‘Cup’ of support under the Crest phase of the wave. When broken, this support level becomes resistance. Specifically . . . price movement below is breaking down with dropping momentum . . . a stage set for lower hi’s and lower lo’s.

Trough Thermometer: Cup of the thermometer is the external Fib level described above. The thermometer itself is a count structure, the right side of which is a 21 count from shock-point. The left side is 16 counts from shock-point, ie Time. This ‘count’ zone serves to consistently remind you, as a trader, to monitor what price is doing as it ‘applies’ into the ‘decision point’ 21.

Fib Vectoring: This ’21 External Fib Point’, this ‘Fib_Tm/Pr Decision Point’ is extremely useful as a vector anchor. Users can select whatever Fib level they want to project to, or two auto selection modes are available, either Crest or Trough. When it comes to support/resistance and fences/vectors, it has been found that using the opposing force provides consistent results. So, with this Trough tool, I choose Crest Fib for the auto setting.

Crest: MTR

The MTR_Crest dll displays resistance levels of the market generated at both the Crest ‘Shock-Point’ and Trough ‘Shock-Point’ of the wave. Directional Bias output is selectable by user, using any Price/Time Fib Fence desired.

Crest Mechanism: The dropping ‘Look-Ahead’s’ (Momentum & Time), of the crest turn, are tracking position relative to the Fib Structure. When the mLkAhd exceeds momentum (crest shock-point), two Fib levels are locked: 1. External, the last Fib level tracked above LkAhds and 2. Internal, the Fib level between mLkAhd and TmLkAhd. The ‘External’ price level becomes a very strong ‘Cap’ of resistance over the Trough phase of the wave. When broken, this resistance level becomes support. Specifically . . . price movement above is breaking out with rising momentum . . . a stage set for higher hi’s and higher lo’s.

Crest Thermometer: Cap of the thermometer is the external Fib level described above. The thermometer itself is a count structure, the right side of which is a 21 count from shock-point. The left side is 16 counts from shock-point, ie Time. This ‘count’ zone serves to consistently remind you, as a trader, to monitor what price is doing as it ‘applies’ into the ‘decision point’ 21.

Fib Vectoring: This ’21 External Fib Point’, this ‘Fib_Tm/Pr Decision Point’ is extremely useful as a vector anchor. Users can select whatever Fib level they want to project to, or two auto selection modes are available, either Trough or Crest. When it comes to support/resistance and fences/vectors, it has been found that using the opposing force provides consistent results. So, with this Crest tool, I choose Trough Fib for the auto setting.

Utilities 2: MTR

The MTR_U2 dll is identical to the 1st utilities dll ‘UT’ but offers 3 additional functions:

1. Ability to show two different Fib Levels at the same time, from either force (leg) of the wave. Trough: Target fib level & Support fib level, Crest: Target fib level & Resistance fib level.

2. Directional Bias Fib Fence filtering for the Trough vs Crest Fib Targeting and Support/Resistance Levels.

3. Directional Bias Fib Fence filtering of the Momentum Cap/Cup (including live mLkAhd tracking).

This dll functions as a stand alone trade environment, painting a clear picture of what state price is in. Reward/Risk is easily measured from clearly defined Support/Resistance levels to target Levels/Zones.

Momentum Mechanism: The dropping and rising ‘Look-Ahead’s’ (Crest & Trough), of the wave turns, are tracking a ‘look-ahead’ position relative to the wave structure. When mLkAhd exceeds price (crest and trough shock-points), two mLkAhd levels are known, above and below. These momentum Caps/Cups are very strong resistance/support levels as they extend over the trough and crest phases of the wave. Specifically . . . this shock-point origin (time) is a consistent action point as demonstrated. Output is either user selectable or ‘directionally biased’ automated in this dll.

CrossOver: MTR

The MTR_XOvr dll provides utility functionality (1-3) and stand alone trade structures (4-6):

1. 45* Targeting and 90* Splits (triggered targeting)

2. Trough/Crest Tm Fences

3. Momentum Wave display

4. Friction Vectors from Trough/Crest

5. Time/Price Levels/Zones of the Friction Vectors

6. Tm Fence Fold-Over Levels

IRF: MTR

As you study the logic, look, and feel of each Burton ‘Square Based’ Cycle Tool (detailed under the Support Structures topic), keep in mind the following and understand that it can take quite a bit of observation over time to achieve proficiency:

  1. In general these tools give ‘Big Picture’ confirmation of price’s relative position overall.
  2. Specific tools are typically used on a specific size chart (ie a ‘Legacy’ chart) that is so good it cannot be overlooked.
  3. Some tools are used to give very specific information following very specific events.

The ‘Return Point’ mechanism of the MTR_IRFmmXL dll demonstrates this nicely and is what we call an IRF (Inertial Reference Frame). The IRF levels of each cycle are output in blue/red based on  price’s relationship with the 270* price level of the cycle. This process works exceedingly well for tracking trends as well as reversals, and reversals specifically invoke a reconciliation state, which is a fundamental ‘Law of Vibration’ precept. This cycle tool features both targeting (‘Law of Three’ based), reconciliation level (‘Market Maker’ based), and expansion level tracking (‘Phi’ based). The picture below shows how knowledge of the reconciliation level, ie Return Point, can be used in conjunction with knowledge of price’s momentum position above the Trough Tm Fences.