BTS9_MTR_Crest

Contents
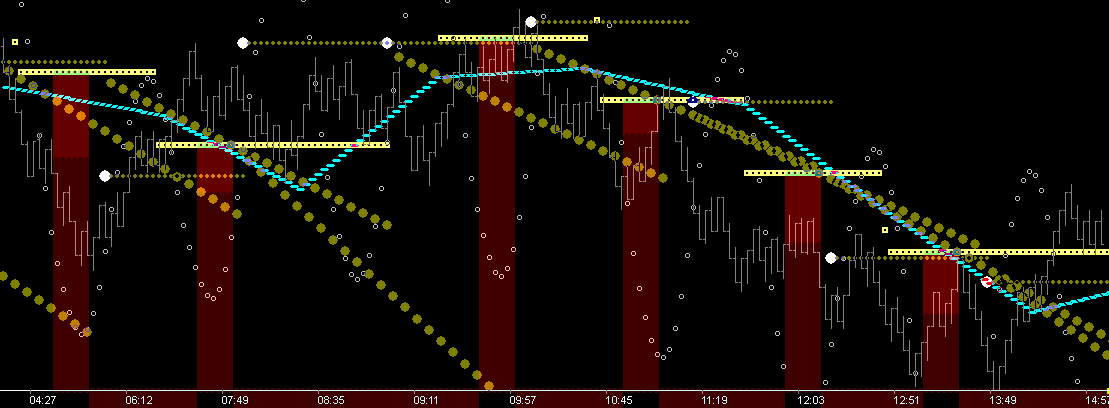
Momentum Tape Reader Crest (click pics to study)
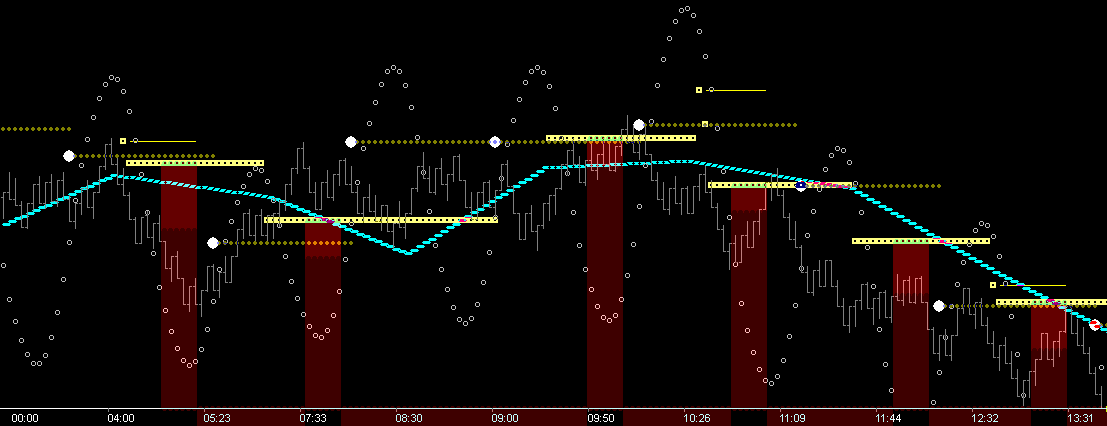
[showing: Crest/Trough (generated) Resistance Levels with dBias filtering]
|
The MTR_Crest dll displays the resistance levels of the market generated at both the Crest 'Shock-Point' and Trough 'Shock-Point' of the wave. Directional Bias output is selectable by user, using any Price/Time Fib Fence desired.
Crest Mechanism: The dropping 'Look-Ahead's' (Momentum & Time), of the crest turn, are tracking position relative to the Fib Structure. When the mLkAhd exceeds momentum (crest shock-point), two Fib levels are locked: 1. External, the last Fib level tracked above LkAhds and 2. Internal, the Fib level between mLkAhd and TmLkAhd. The 'External' price level becomes a very strong 'Cap' of resistance over the Trough phase of the wave. When broken, this resistance level becomes support. Specifically . . . price movement above is breaking out with rising momentum . . . a stage set for higher hi's and higher lo's.
Crest Thermometer: Cap of the thermometer is the external Fib level described above. The thermometer itself is a count structure, the right side of which is a 21 count from shock-point. The left side is 16 counts from shock-point, ie Time. This 'count' zone serves to consistently remind you, as a trader, to monitor what price is doing as it 'applies' into the 'decision point' 21.
Fib Vectoring: This '21 External Fib Point', this 'Fib_Tm/Pr Decision Point' is extremely useful as a vector anchor. Users can select whatever Fib level they want to project to, or two auto selection modes are available, either Trough or Crest. When it comes to support/resistance and fences/vectors, it has been found that using the opposing force provides consistent results. So, with this Crest tool, I choose Trough Fib for the auto setting.
|


The MTR_Crest dll can be set to display the following Resistance features of the Burton Momentum Wave:
1.Crest (generated) Res Thermometer Cap level (crest mLkAhd falling below price, marks external Fib level and 16 to 21 time zone)
2.Option to display Trough (generated) Res Momentum Cap level (trough mLkAhd rising above price)
3.Option to display Trough (generated) Fib Vectoring (Tm21_FibPr anchor to user selected Fib Pr/Tm)
4.Option to use Auto Directional Bias output filtered by user selected Fib Price/Time Fence (shown in examples)
5.Option to display Fib Fences: Trough, Crest or both
6.Option to display Fold-Over levels of the Fib Fences
7.Option to display Trend vectoring from Thermometer to Thermometer
8.Option to display Time Fences: Trough, Crest or both (overrides Thermometer display)
9.Option to display the Momentum Wave
Remember This Fundamental of Learning: |
Each of the vibrational components of this Wave Based tool provide a unique 'Squared' and 'Phi Rich' structure to any chart. Successful trading comes when two things are understood:
1.The structural RELATIONSHIP of the above features (specifically created by price action) and . . . 2. Price's position in 'Relation' to this 'RELATIONSHIP'
It is suggested and highly recommended that users add only one structure and concept to their trading at a time. Complete clarity of the trade precepts (action points) of each must be understood and internalized before a 2nd can be added successfully.
Observe . . . find what you like . . . observe . . . what speaks to you . . . observe . . . make it your own . . . use it.
This help file is about helping you accomplish that . . . review these charts often.
|
Learn More: