BTS9_MTR_XOvr
Trade Structure Details (Trough Tm21)User Selectable Time(things to consider when making it your own)[Users can select any number of Fib Time/Price points as the 'Proof-Point' of action] |
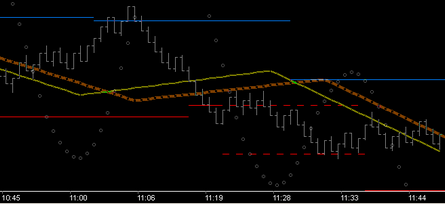
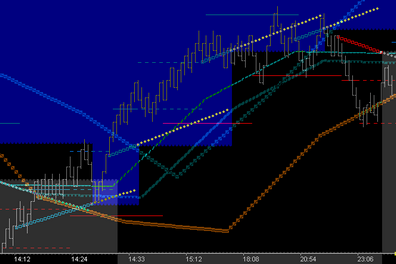
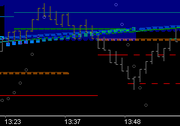
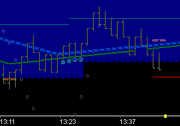
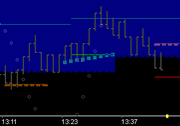
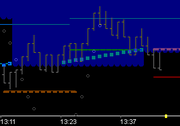
The MTR_XOvr dll can be set to display the following Support/Resistance features of the Burton Momentum Wave:
1.Option to display Friction Vectors: Trough, Crest, or both (projected to selected time)
2.Option to output Directionally Biased structure based on Tm Fence selection: Trough, Crest or both
3.Option to display the Separating Time/Price Levels/Zones: Trough, Crest or both
4.Option to display Applying Time/Price Levels: Trough, Crest or both
5.Option to display 45/90* Targeting: Trough, Crest or both (or any target level in degrees of time)
6.Option to display Time Fences: Trough, Crest or both
7.Option to display the Momentum Wave
Remember This Fundamental of Learning: |
Each of the vibrational components of this Wave Based tool provide a unique 'Squared' and 'Phi Rich' structure to any chart. Successful trading comes when two things are understood:
1.The structural RELATIONSHIP of the above features (specifically created by price action) and . . . 2. Price's position in 'Relation' to this 'RELATIONSHIP'
It is suggested and highly recommended that users add only one structure and concept to their trading at a time. Complete clarity of the trade precepts (action points) of each must be understood and internalized before a 2nd can be added successfully.
Observe . . . find what you like . . . observe . . . what speaks to you . . . observe . . . make it your own . . . use it.
This help file is about helping you accomplish that . . . review these charts often.
|
Learn More:

