Chart/Symbol Setup

Contents
| Mandatory: You must have your Data Feed installed following the FTGT program instructions. |
Detailed instructions from FTGT site found here.
Guidelines for Symbol Setup using DTN's IQFeed. (click on pics to enlarge)
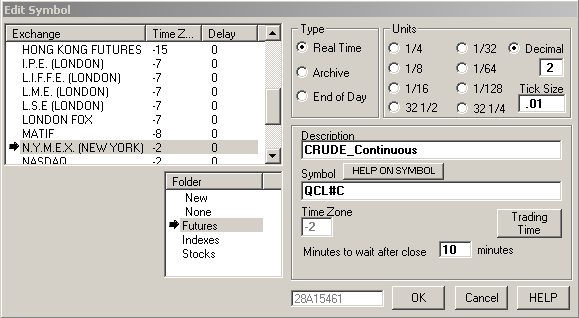
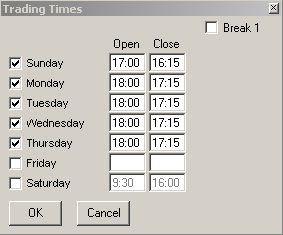
Crude Oil Futures . . . Symbol CL
|
Setup new Symbol in FTGT: 1.File 2.Symbols 3.New Symbol
|
Euro Futures . . . Symbol EU
|
Note: The 'Time Zone' field setting is automatic . . . do not try to match what is showing in the pics.
|
Dow Futures . . . Symbol YM
|
Note: The 'Description' field can be whatever name you want to give this symbol. |
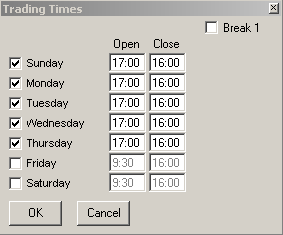
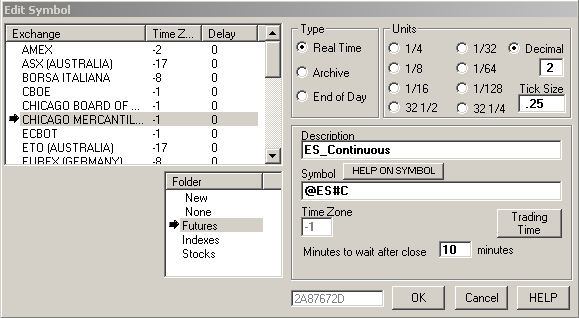
S&P Futures . . . Symbol ES
|
|


After symbol setup (as shown above) the next step is to create a chart. (click on pics to enlarge)
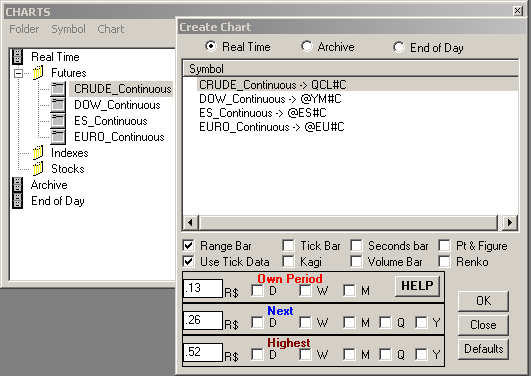
Crude Example
|
Add new Chart in FTGT: 1.Chart 2.Right-Click on desired Symbol [futures folder] 3.Create New Chart 4.Select Range Bar [check] 5.Select Use Tick Data [check] 6.Fill-In chart [fractal] size [Own Period] 7.Fill-In Next and Highest Period
Note: I use x2 for Next & High period . . . does not matter since they are not used.
Settings as shown will create a 13-tick range bar Crude Oil chart. Clicking 'OK' creates the chart. Clicking 'OK' more than once creates another chart. Clicking 'Close' exits the 'Create Chart' window. Select another symbol to create chart for that symbol or close the 'Charts' window [x]. |
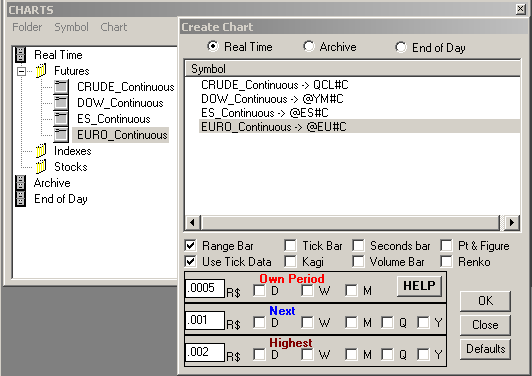
Euro Example
|
Same process as above.
Settings as shown will create a 5-tick range bar Euro chart. (Create one or both charts for later use)
IMPORTANT NOTE: Before proceeding you need to set the 'Max number of ticks per tick file': 1.Utilities 2.Global Settings 3.Tab 7: Ticks 4.Set 'Max number of ticks per tick file to 7000000 5.'OK'
Note: Changes made do not 'save' until program is closed. |
Important Step in Chart Creation |
EVERY chart created needs 3 additional steps applied. The procedure, as shown in the video, is to:
1.Toggle Top Scroll-Bar [left-click]
2.Set 'Fixed Pixels' [right-click in price scale area]
3.Set 'Ticks to Read' to 800,000 [left-click Fibonacci Trade-Mark area]
Note: Fractals larger than 13 need 1,200,000 ticks
ES Note: The S&P is a special case (because of it's churning), and requires ~2,800,000 ticks or more . . . depending on chart fractal size.
Alternate YouTube Viewing:  |
After chart creation (as shown above) the next step is to update data for each symbol.
|
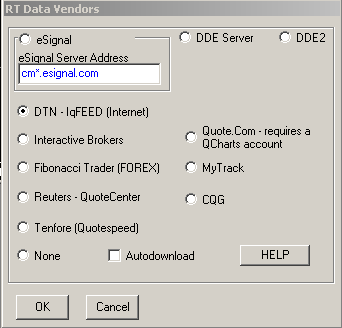
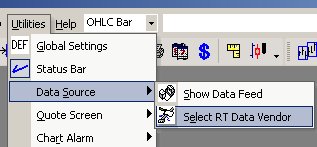
Update Data for each Symbol in FTGT: 1.Turn on Data Feed 2.Utilities 3.Data Source 4.Select RT Data Vendor 5.Select your Data Vendor as shown. 6.Click 'OK' brings up you Data Vendors Login 7.Login and you are ready to update data
You will notice I do not have 'Auto download' checked. Each morning I turn on the data feed and update a set # of ticks for each market.
Examples:
1.CL, ES . . . 600,000 2.YM, EU . . . 400,000
Note: Updating more ticks is necessary if you are building data for the 1st time or filling in missing data. |
|
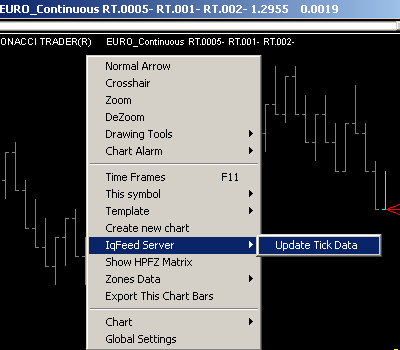
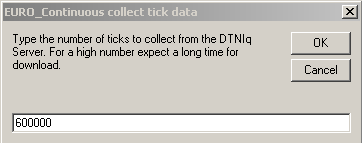
Once logged into your Data Vendor and receiving incoming data: 1.Right-Click on a chart of the Symbol you want to update 2.Select the data server as shown 3.Click 'Update Tick Data' 4.Fill-In the number of ticks you want to update and 'OK'
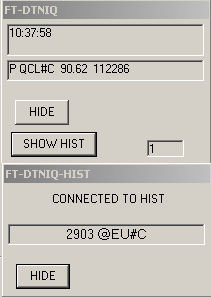
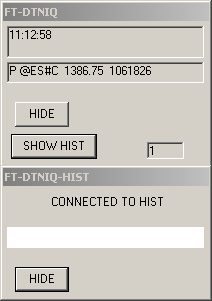
While data is downloading IQFeed's client shows two windows. Top is Real-Time data collection and bottom is collecting from the History server. When the 1st phase 'downloading' is complete, bottom window shows a white band while the packets are compiled on your computer in the updated data file.
Download 2 or 3 million ticks for each symbol. |
With the above Symbol, Chart and Data Update process complete . . . you are now ready to proceed to the dll installation process.