As you study the logic, look, and feel of each Burton ''Wave Based' Cycle Tool detailed in this chapter, keep in mind the following features and how you can use them to benefit your trading:
1.Geometry is projected in the future, enabling price/time relationships to be seen well in advance. Successful Trade-Entries are based on these relationships.
2.Tools work the same on any size fractal (chart). Both trade-entry fractals and dBias 'bigger picture' fractals used should be chosen with thought given to the vibration rate of the particular market being traded.
During a typical week (5 days of trading) the Crude Oil fractal_8 chart has 127 cycles. That means 127 cycles, exhibiting the same vibrational truths, provide repetitive trade opportunities.
During the same 5 days the Euro fractal_8 chart has only 24 cycles. That means 5 times fewer trade opportunities. It also means that any stop taken has a much longer real-time waiting period to the next qualified trade entry, ie opportunity for recovery, which is extremely important to successful trading. A 4-tick chart has 105 cycles and provides a much better 'time-to-recovery' factor. [5-tick is generally 66 cycles while 3-tick is 192 cycles] However, the caveat to this is that you must adjust profit expectations accordingly. A smaller fractal will have fewer ticks to target, etc.
The Dow fractal_8 chart typically has 48 cycles and the ES fractal_8 chart typically has 128 cycles (but is a special case).
Fast moving markets are much easier to trade, providing greater reward and quicker opportunity for recovery.
So . . . trade-entry charts should be sized to provide enough cycles/day that the pulsing of price through the vibrational structure can:
1)be taken advantage of with consistency (in sync with larger fractal directional bias)
2)demonstrate clear directional bias (in sync with larger fractals) and
3)provide enough cycle rotations (information) to allow for recovery (from a stop-loss exit) at the next cycles time/price entry levels
Summary: Slower moving markets dictate smaller fractals for entry . . . trade a market with clear directional bias on a larger fractal . . . taking entries from smaller fractals as they line-up and agree with the bigger fractal picture.
3.Most tools provide user-selectable directional bias switching.
4.Most tools identify momentum break-out timing points and price levels . . . ie the point of change from buying to selling, etc.
5.'Proof-Point' Relationship Logic is employed in all tools.
6.All tools clearly show what you cannot do. Understanding this is fully half the battle . . . because it mandates patience for opportunity.
Because the Wave 'Utilities' dlls give a good synopsis of the many wave features . . . they are a good place to start.
Square Based (Support Structures)
As you study the logic, look, and feel of each Burton 'Square Based' Cycle Tool detailed under the Support Structures topic, keep in mind the following and understand that it can take quite a bit of observation over time to achieve proficiency:
1.In general these tools give 'Big Picture' confirmation of price's relative position overall.
2.Specific tools are typically used on a specific size chart (ie a 'Legacy' chart) that is so good it cannot be overlooked.
3.Some tools are used to give very specific information following very specific events.
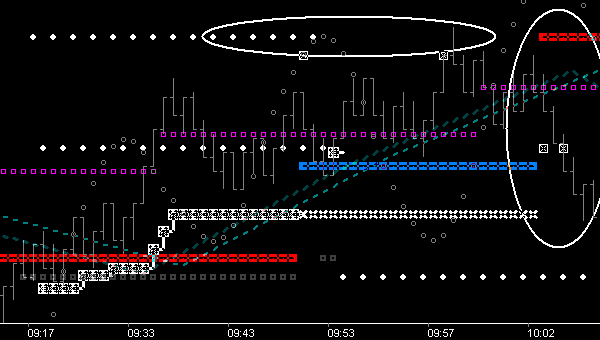
The 'Return Point' mechanism of the MTR_IRFmmXL dll demonstrates this nicely and is what we call an IRF (Inertial Reference Frame). The IRF levels of each cycle are output in blue/red based on whether price's relationship with the 270* price level of the cycle. This process works exceedingly well for tracking trends as well as reversals, and reversals specifically invoke a reconciliation state, which is a fundamental 'Law of Vibration' precept. This cycle tool features both targeting ('Law of Three' based), reconciliation level ('Market Maker' based), and expansion level tracking ('Phi' based). The below pic shows how knowledge of the reconciliation level, ie Return Point, can be used in conjunction with knowledge of price's momentum position above the Trough Tm Fences.
[showing: Resistance level (red) is broken through after 9:17. Price at the same time is moving above Trough Fences so price is in an upside momentum position. Price completes the opposing force 'mirror' target level (1st level white dots), and subsequently moves above and into a new cycle. Target level of the new cycle is completed just after 9:57 and most importantly, that pivot high is 2.6 expansion (2nd level white dots) from the previous cycles breakout zone. I know several things about this chart:
1.The completion rate of Return Points is over 90%
2.Very seldom does price exceed the 2.6 level from the reconciliation cycle
3.I can short at the 2.6 level (with a stop)
4.Or I can wait for proof-point (which should have momentum behind it), and would be:
a.Break below Trough Fences
b.Negative IRF coming on (red)
c.or both would be perfect alignment
d.and I can see it coming in advance
Knowing where these 1.6, 2 and 2.6 levels are provides timely information consistently on key charts, and works well as additional 'Support Structure' confluence so important in trading.]
Because the MTR_IRFmmXL 'Support Structure' dll provides 'feedback stats' used in selecting significant cycle origins . . . it is a good place to start after you have found success with the 'Wave Based' tools.