Trading and You

Contents
Understand that it is quite difficult to change you . . . the core you . . . all those subtle and some 'not so subtle' individual idiosyncrasies that in the end . . . are you. And You . . . are very hard to change. Over the last 6 years of mentoring traders I have found this the most challenging aspect of mentoring and I have come to understand it is better for you to just embrace your personal make-up and trade in sync with yourself.
Ironically . . . by embracing yourself initially . . . change can then come as observation over time will refine your belief system and empower you to change . . . in many ways.
Some examples of how you might apply your personality to your trading:
➢If you see the glass as 'half-empty', you will probably do better shorting in a market that has a negative directional bias. You would be best advised to not trade a positive directional bias . . . ie, wait for the change to negative directional bias and trade only shorts. (Do the opposite if you are a 'glass half-full' type.)
➢If you are the nervous type and always take profit quickly, then you will do better trading a smaller chart (smaller fractal). You will not do well trading for 5 ticks by looking at a 21-tick range bar chart. This applies to stops also. If you insist on a 5-tick stop . . . you cannot trade a 21-tick chart successfully because time to next valid trade is too long relative to reward. Build your charts according to your ability to hold onto a winner moving to price target.
➢If you don't do well with relationships . . . Burton Cycle Tools may not be right for you. :)
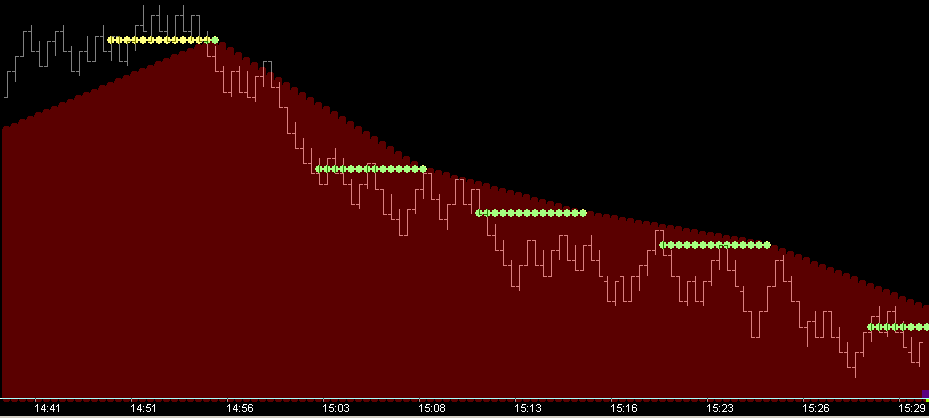
The single best 'controlling force' of directional bias is the Time-Fence. If you can see the relationship in the negative directional bias Time-Fence (shown below), and trade it by entering a short when the price bar has a high-close at or near the Time-Fence level, then you can be successful trading.
If you do not see this relationship or cannot trade shorts when price is below this fence then you may have a contrarian nature which may be hard to overcome (ie, a relationship problem). |

➢If you have difficulty assimilating concepts, be very selective in what you add to your chart and don't add any 'layers' of information without proper understanding of their relationship. (observe and discern)
As shown previously, sometimes just the Time-Fence is enough to give good entry and profit. I like to use the fence Fold-Over level in my trading (as shown below). In the case of a negatively biased fence (down-sloping with price below), this fold-over level is essentially the top of the square and I am keenly aware that price moving above this level, especially towards the end of the marker (fold-over point), could be positioning for change. This was clearly the case at about 14:54 when price dropped precisely at the fold-over into the negative zone. I also know that downside pressure (momentum) exists at the beginning of this marker. Since I know and understand this, I use it to my advantage.
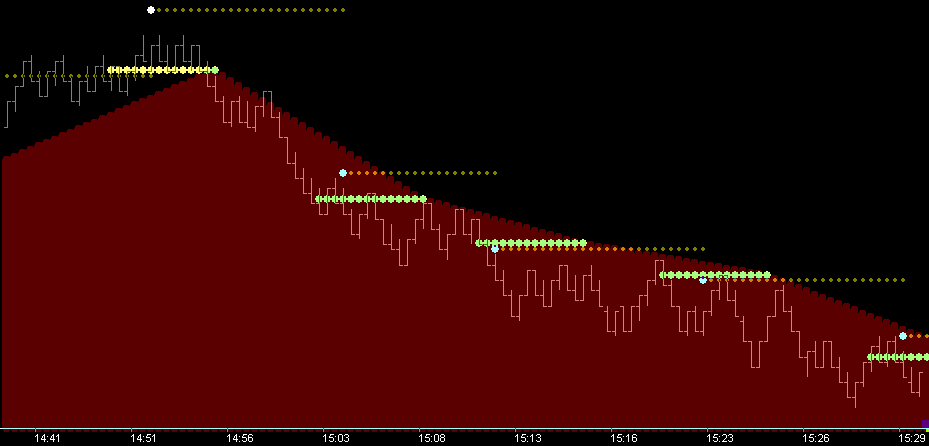
The Momentum-Cap level (added below), marks the price where the rising momentum from the trough leg of the wave first exceeds price itself. This level would have to be broken (exceeded by price action) for things to begin to change. The relationship of this level with the fold-over level and the time-fence level tells me where my short entries can be taken relative to a risk-tolerable stop.
Hopefully you can see the building block nature demonstrated in the above charts. Each of these components of vibration are meaningful and completely trade-able in their own right . . . but the relationship of these components as they align on a single chart and across fractals is key to trading in sync with directional bias with limited risk. |
➢If you are overly emotional you will have great difficulty trading in general. Emotion is generally a sign of fear and fear will only be overcome with knowledge. Once you have observed enough to understand directional bias, the position of price, and where the correct trade is, fear will slowly subside and you will begin to enjoy emotion free trading.
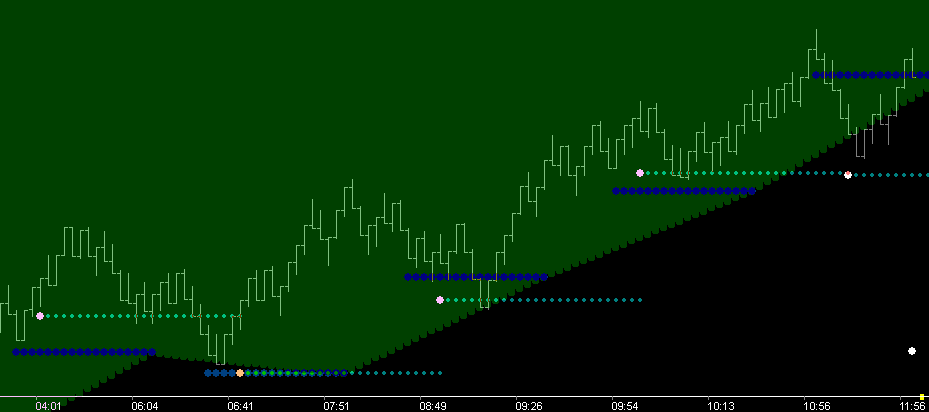
Previous charts showed clear 'Negative' directional bias with price below time-fence. The chart below shows market with clear 'Positive' directional bias. The three components shown are exactly the same; Time-Fence, fence Fold-Over level, and Momentum-Cup level. In this case, a positively biased fence (up-sloping with price above), the fold-over level is essentially the base of the square. The Momentum-Cup level marks the price where the falling momentum from the crest leg of the wave first exceeds price itself. This level would have to be broken (exceeded by price) for things to begin to change. The relationship of all these levels combined tells you where long entries can be taken relative to a risk of change in the directional bias.
Warning: Strong emotions while trading are usually caused by prior losses or inadequate/inappropriate trade funds. Do not trade until you have adequate funds and can focus on 'trading to build' your account. When trading to 'build your account' you must only trade 'in sync' with direction in clearly structured markets with: 'Positive' momentum as pictured here and 'Negative' momentum as shown previously.
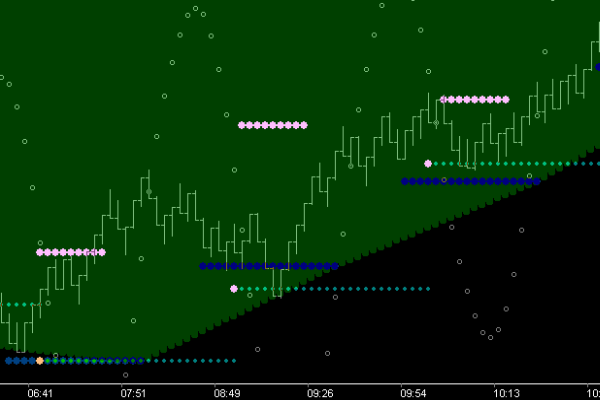
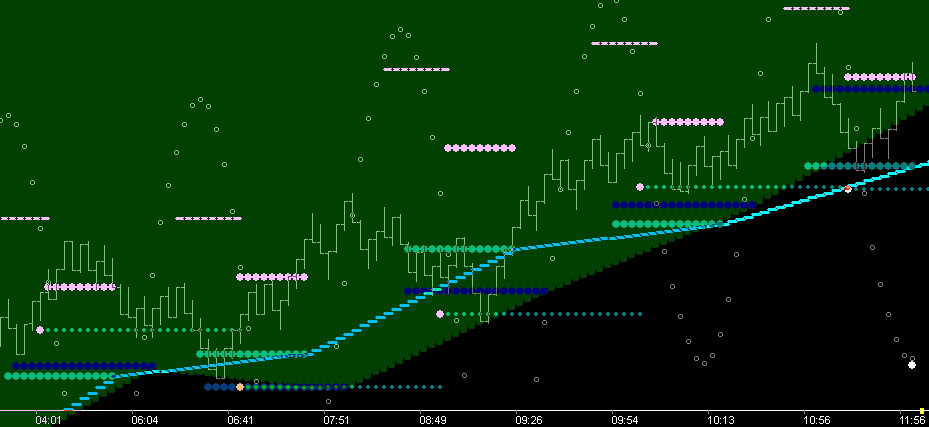
When trading to build your account and when trading to 'learn' to be a better trader, you must trade the PHI structure of the wave (with momentum direction as shown) for highly probable Fib-Count price levels. In the below chart I have added both the wave and the Fib-8 price level output (shown as white dots). The process of profiting larger amounts in your trading begins with understanding that entry on retracements to support levels (as shown in this chart, and entry at resistance levels in a negative biased market as shown in previous charts) is an entry for price to move to a target level. When using the Burton Momentum Wave the Fib-8 level is such a target and is known well in advance. Price target is known and retracement level is known, so reward to risk is easily calculated when price is in the retracement zone where the relationship of the support components exists. Successful traders will take those trades where the risk is tolerable based on their account size. Fundamentals: trade for continuance rather than change, price consistently moves to the extreme threshold of change (ie, early entry is usually not rewarded, patience is rewarded).
One last thought before moving on. If the market is trying to get to the Fib-8 level, it should make sense that en-route to 8, price must pass above other significant Fib-Count levels. So below I have added the Fib-0 level (white level above 8) which serves to give 8 a relationship with this vibrational space. Now if you've done your reading you know that the average wave length is 26, which makes 17 a time component while 8, being a third, is another time component. So 17 is a proxy for time and a very significant level from cycle to cycle. In the chart below I have added the Fib-17 level (green dots) and connected them with a Fib-Fence (shown in cyan). I want to trade for Fib-8 target when market is positively biased and when price is in route at the right 'time'. (ie, above Fib-17 fence)
|
Applying any or all of the above takes knowledge and continual exposure to an accurate picture of market vibration. This is the purpose of Burton Cycle Tools and this help file with numerous examples . . . keeping you on the right side of vibration . . . trading for profit.