The chart pics in this section will give you a quick look at the scope of Burton Cycle Tools. Descriptions are intentionally kept brief. The objective is not to teach you every single detail but to familiarize you with some basic principles of the tools and how they provide trade-able structure to vibration. Certain aspects of specific tools may speak to you in a significant way. These are the tools that you will want to explore.
Throughout this help file, as you study the example charts, always step through the price action bar by bar (left to right), understanding that all the structural geometry was projected in the future (in real-time) and get in the habit of picturing the action points as they occur. Example: "price is now capped or bracketed by X (the proof-point), so unless that support/resistance (proof-point level) is broken, I am now taking longs/shorts accordingly to my stop tolerance relative to proof-point".
(Note: All times shown on charts are 'market time'. My trading day begins at 6:00 a.m. MST: shown as 7:00 a.m on CME charts, 8:00 a.m. on NYMEX charts.)
Each morning Burton Cycle Tools provide a clear perspective of where the market is positioned. Even when that 'clarity' is that there is no clear directional bias. By reviewing a few key principles users are quickly prepared to: 1.) enter longs on retracements to support, 2.) enter shorts on retracements to resistance, or 3.) wait for directional clarity.
CME_Euro
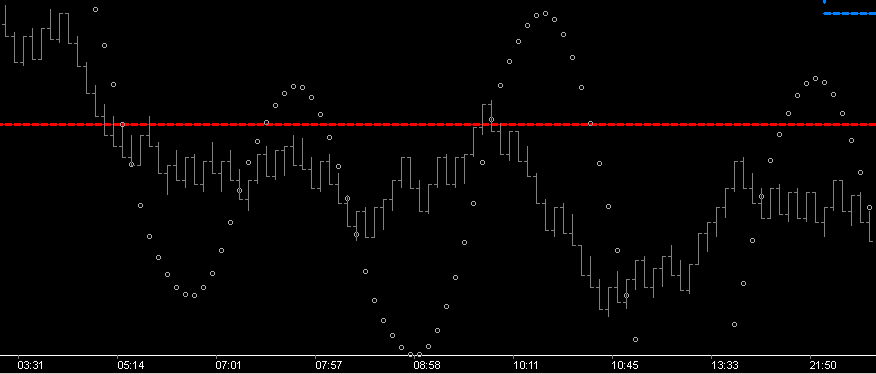
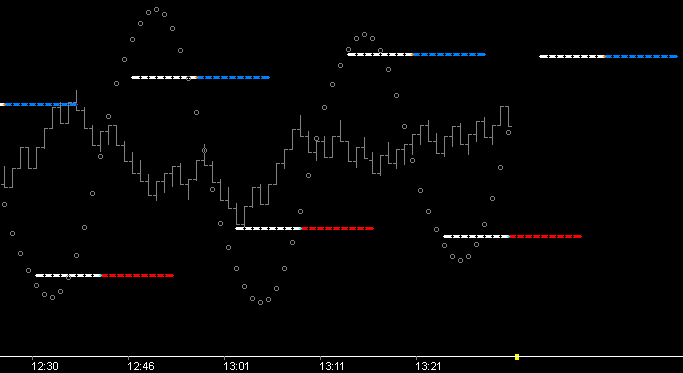
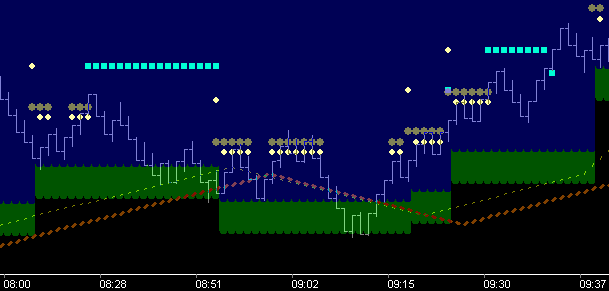
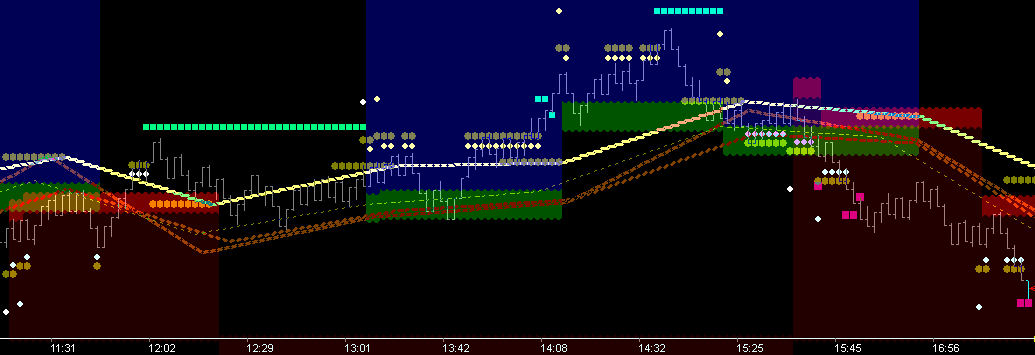
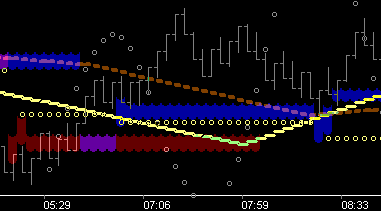
The PTWavLHHL dll shows prices position relative to the last higher-lo and lower-hi. Price spends the vast majority of its time between these two levels. When price, at the open of my trading day, is below the higher-lo level (red line), I am only looking to enter shorts for continuance in the downside direction. Price, when in this position, is expanding (with momentum) to the downside and it is very difficult for price to break back thru this higher-lo level. Price is much more likely to continue pulsing down from retracement levels until price action eventually puts in a new higher-lo.
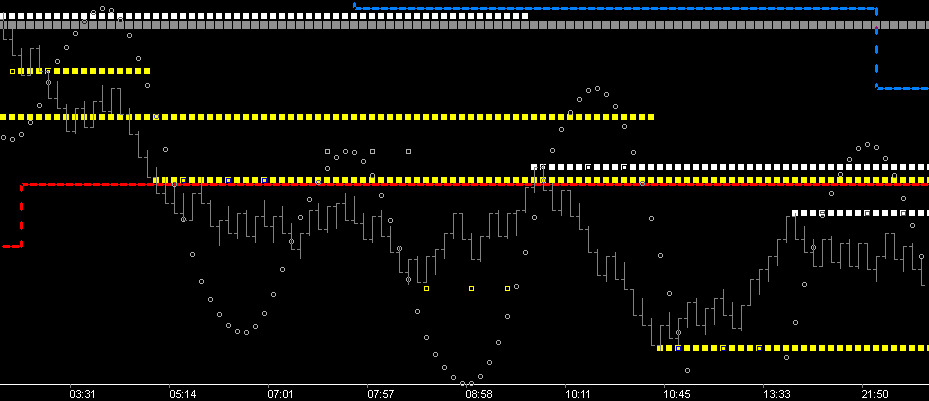
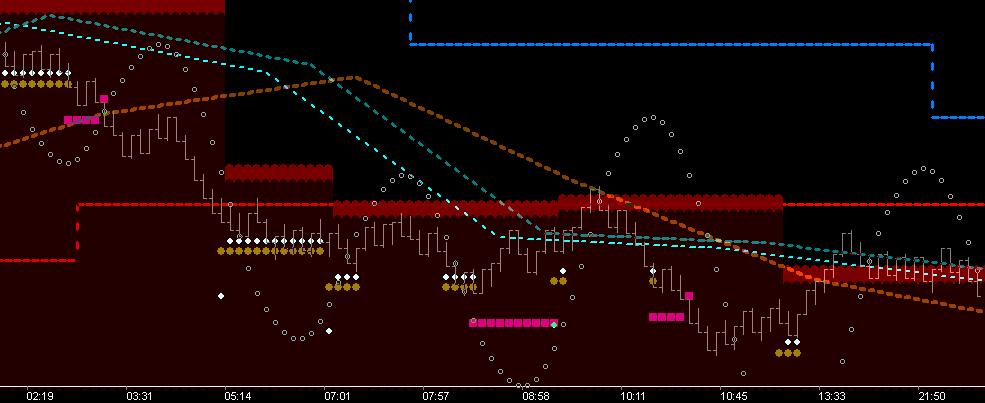
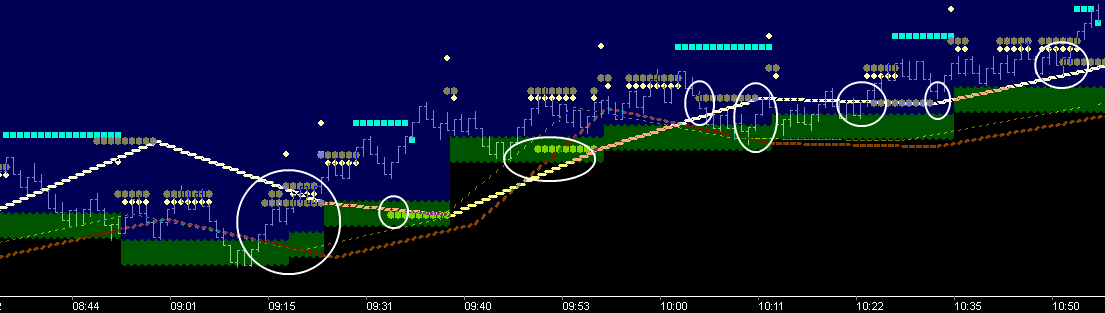
The comprehensive mSqrXL dll easily confirms both expansion direction and retracement level bracketing, adding clarity to specific timing points and resistance/support levels established by price-action. 9:53 . . . price would have to move above white level to change downside bias, 10:44 . . . price would have to move below yellow for further negative expansion, 15:51 . . . price would have to move above white for any further upside, and any move above white would then be in a small range bracket, captured by prior up and down expansion levels.
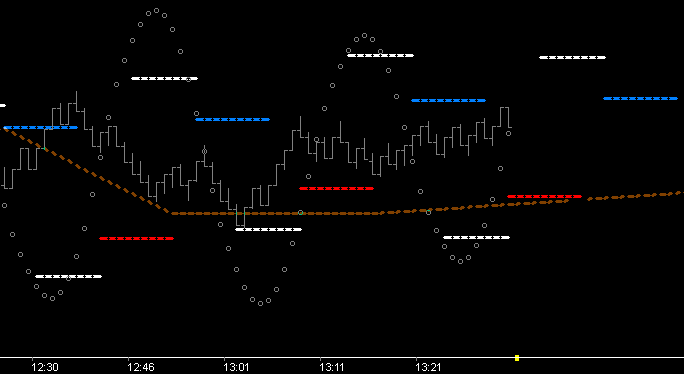
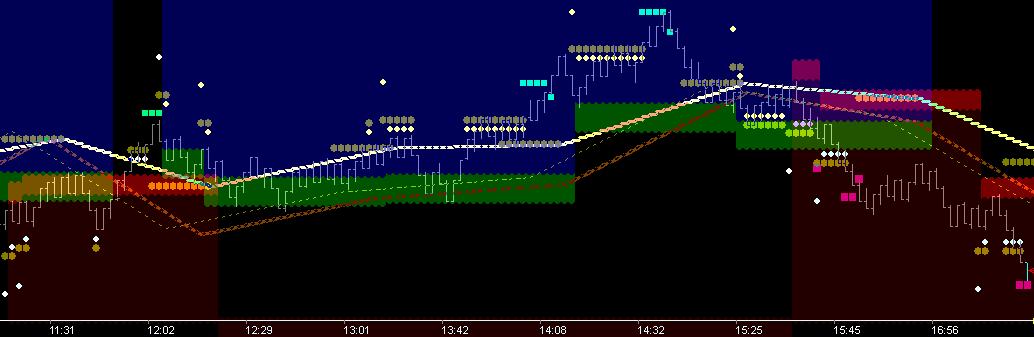
A time-fence that provides consistent resistance/support to a directionally biased market is invaluable. The MTR_Crest dll shows three components here. The trough time-fence 34 (TmFn34) (red), plus the fib-count 26 level and fence (FbFn26) (brown/ivory). This dll capitalizes on the Phi-rich environment of the vibrational wave. When considering the timing or run-rate for these components I apply the following logic: 26 is a cycle of time, 13 is a midpoint proxy, 8 is a trine and time proxy (.333), 17 is pure time proxy (.666), 21 is major Phi point of cycle . . . 5 from cycle end, and proxy midpoint to 34, which is 8 into next cycle.
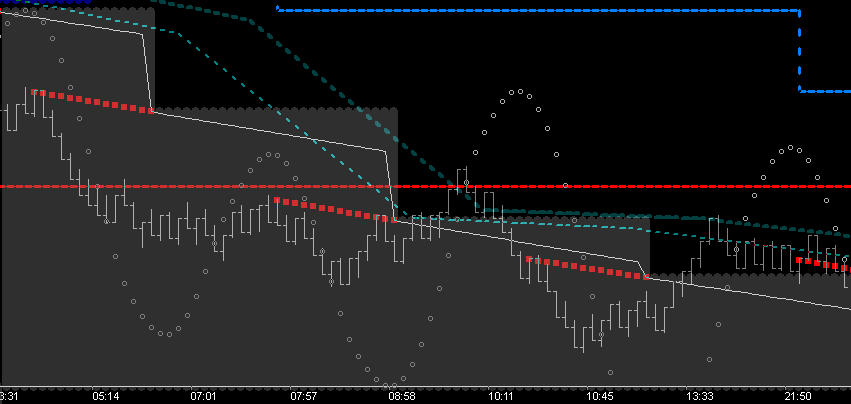
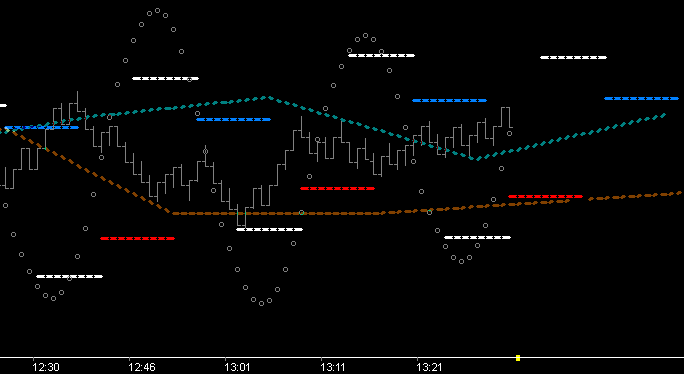
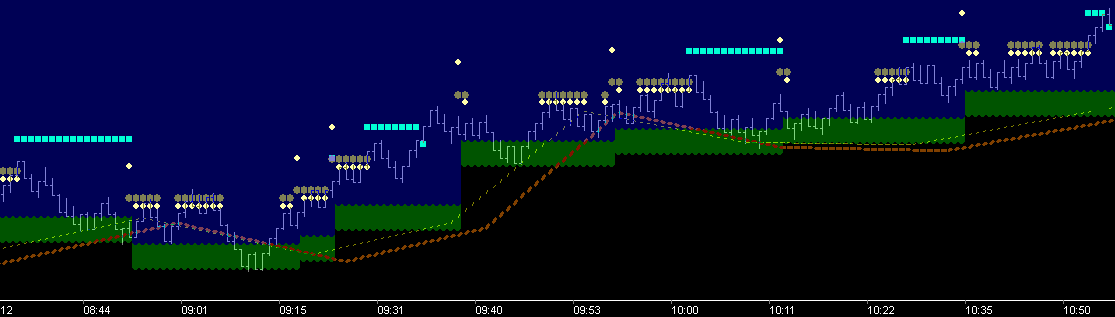
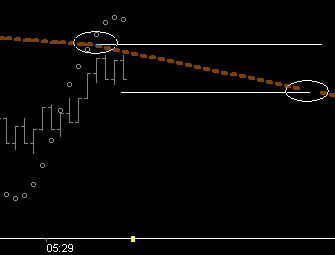
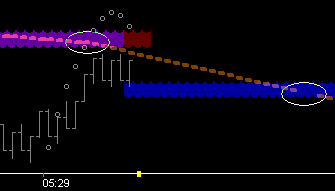
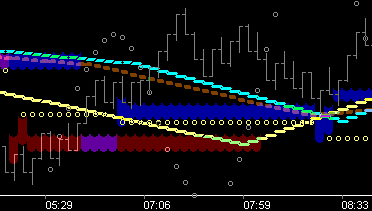
The MTR_XOvr dll,auto-filtered by time-fence, also provides predictably accurate directional bias and numerous trading precepts. Time fences shown here and filtering direction are the trough 26 and 34 (dashed cyan lines). You will note that the heavier and darker cyan dashed line (TmFn34) is the same as the red level in the previous chart. The grey horizontal levels are marking crest Tm13 levels, essentially a proxy for the trough of the wave. Since wave momentum is starting to rise at the trough, retracement moves starting at this point in time are a consistent event. Now notice that upside breaks came at 17 (time) and continuance turns at 21
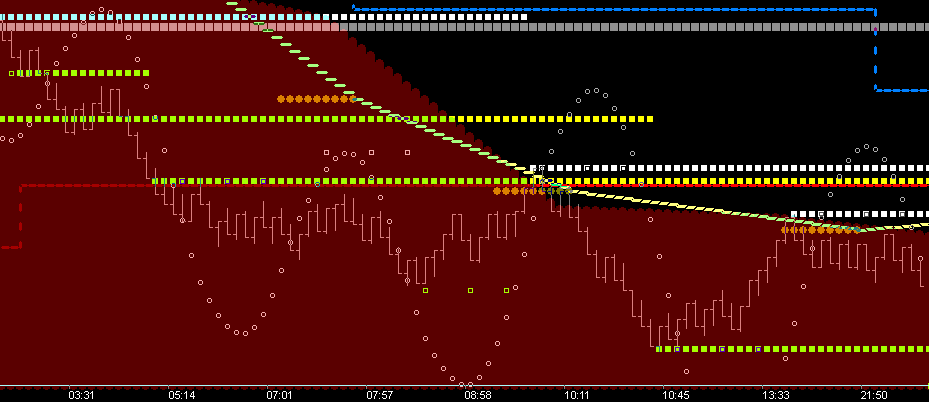
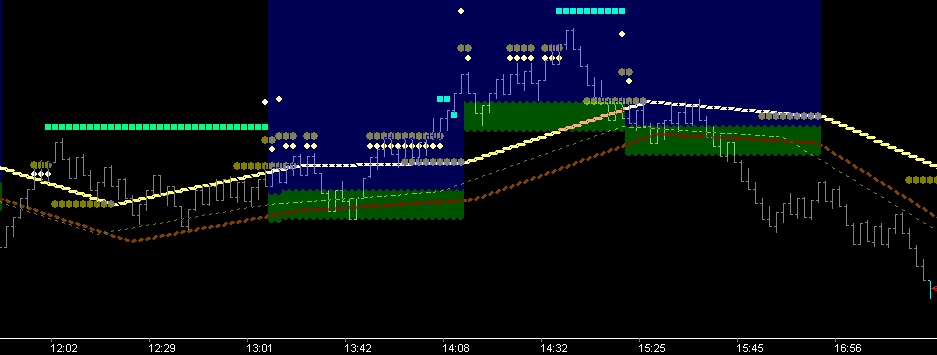
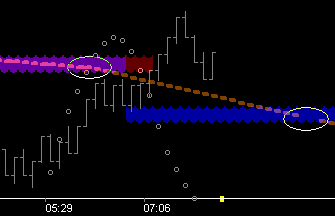
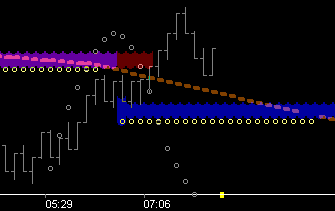
The gNomonic 'mirror zone' of the gBmprN dll, auto-filtered by time-fence, fits perfectly into the same category of directionally biased tools. Trade entry opportunity at the upper red zone is trading for price to hold at that level and expand down to gNomonic target level (shown in pink when triggered). A retracement to this extreme level following trigger (8:26) is the trade. And the market does you a favor when it triggers a 2nd target (10:27). Note: the pivot high (9:52) was exactly at the crest TmFn45, which was 1st penetrated at 3:17 a.m. Price below crest 45 fence is extremely negative. Price above CR45 and below TR45 is bracketed.
When the directional bias of the market is clear (established) . . . further clarity or 'measure-able reward clarity' starts to emerge. Four different types of price level targeting methods are available with Burton Cycle Tools. They are: 1.) Friction Vector 45*/90* Levels, 2.) Fib_Count 8 Levels, 3.) gNomonic xPansion Levels, and 4.) Master Square ET Levels.
NYMEX_Crude Oil Futures
CME_Euro (prior example)
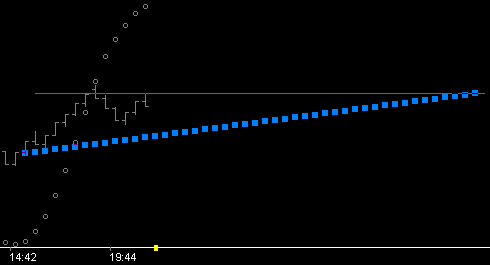
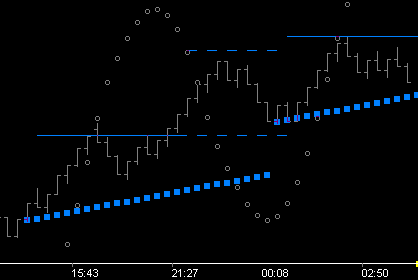
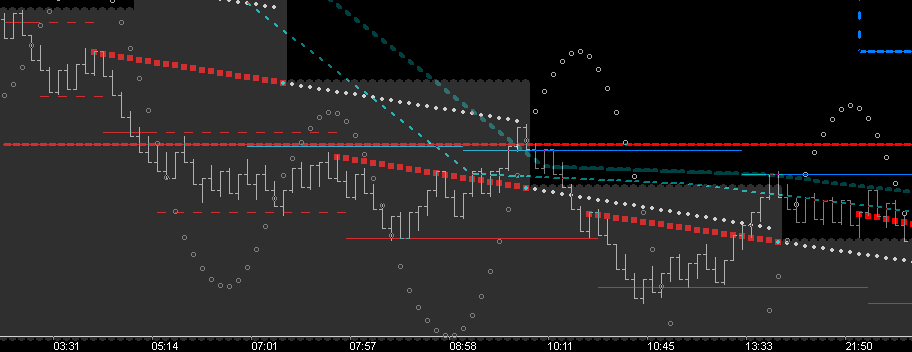
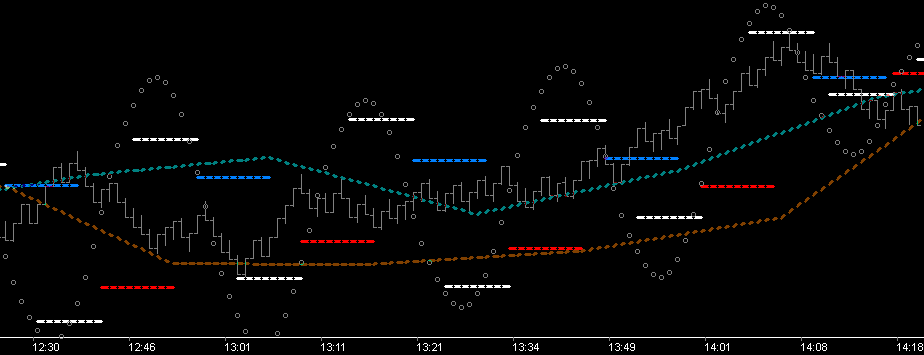
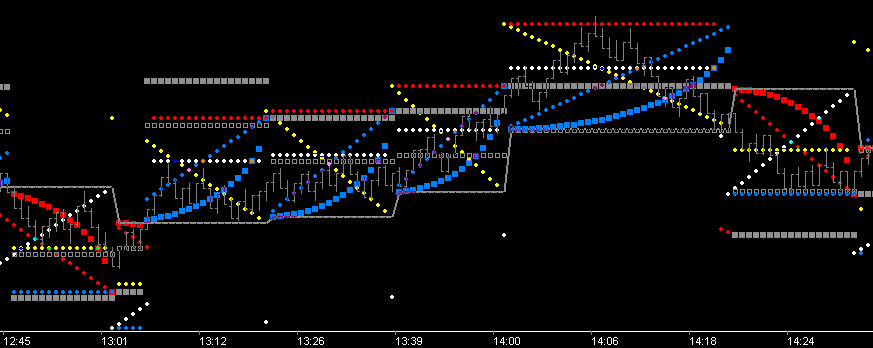
The MTR_XOvr dll outputs the friction vectors of the wave. Shown here is the trough vector. 1st pic is showing the vector running out 45 units of time and the horizontal level is set to 45. That is a SQUARE. This 45* price level is a strong targeting component of vibration . . . when the directional bias agrees. When the 45* level is exceeded (2nd pic) the tool outputs the 90* level (higher dashed line). This 'triggered' 90* level provides 'intent to continue upside' in a following cycle (as shown). However, while these two charts demonstrate the 45/90* targeting mechanism of the wave, they do not show the 'retracement zone entry' of the bigger picture. Now . . . add this friction vector price level targeting to the previous directional bias example . . . you can see that the initial break-down was triggering a 2nd level down (completed), followed by another (completed), followed by a solid hit of 1st level in the next cycle, with retracement to opposing force Sqr level (blue), followed by another 1st level down and then another retracement (including Sqr blue hit). Understand this is precise vibrational bracketing giving trade entry and exit zones.
The Burton Momentum Wave Fib Levels can be output by the
MTR_U2 and MTR_UT dlls, and provide targeting, support/resistance bracketing, and momentum timing structures. Shown in pic 1 are the crest and trough Fib Zero levels. The white sections run from bar count 5 to 13 and are fixed. The blue and red sections run from bar count 13 to 21 and are adjustable in length and height (ie, Fib level). The Fib_0 level is often a turning zone because of its relationship with the wave turn. It can also be a strong momentum break-out level, depending on its relationship with key time fences. The Fib_8 level (pic 2 is a consistent targeting level when used in conjunction with directional bias and alignment with Fib_8 levels of other fractals. Pic 3 then shows the necessary addition of a time fence. A crest fence (as shown with price above) is used to bracket against further downside, and price giving relationship entry at crest fence level is traded for 1.) upside crest Fb_8 targets (blue) and 2.) price movement to opposing force trough fence. Price below crest fence has downside momentum until it rises back above. The crTmFn_26 shown here is standard cycle support since the wave length is 26. The opposing force aspect is the trough fence, trTmFn_26 (pic 4). Price above trough fence has upside momentum (pic 5), and trade entries use trough fence relationship entries for further momentum upside targeting, until price drops back below and is bracketed by trough and crest fences again.
Relationship components which can be used for 'upside alignment timing' include:
1.) Crest Momentum Cup Level
2.) Trough Time Level
3.) Trough Fib_17 Fence
4.) gNomonic Mirror Zone
Consider This:
The Phi component of the Crest Fib Ladder (ie, FbTm_cr17) is exceptionally strong in terms of momentum above . . . retracement and consolidation below. (review next example)
(it should be used as your #1 timing tool . . . adding significant clarity to potential break-outs to targets [proof-point time and price] as price applies into the 13-21 count zone at the cr17 level)
Note: This level is known well in advance . . . 13 bars to be specific.
gNomonic xPansion Targets are output by the gBmprP and gBmprN dlls. gNomonic targets are triggered by a close beyond the bumper zone. gNomonic targeting provides valuable trade information. A market that is triggering upside gNomonic targeting is positively biased. Support structure for upside price continuance is output as the gNomonic Mirror Zone (opposing force levels) as previously shown and further discussed here. Entry for gNomonic targets should only be made at these mirror levels with alignment timing. In pic 1, target is triggered at 8:25, followed by retracement to 'Mirror Zone' (entry opportunity). In the 2nd cycle, price is held by the 108* bumper level, with retracement to Mirror Zone again, however, note that this zone hit is below fence and has reversed the crTmFn_26 directional bias. Entry at this level looks good in hindsight but in real-time this could only be traded as a 'last-man standing' entry (ie, tight stop). This is an example of a proof-point setup. Your thought should be: 'Price has changed the directional bias, so now I need renewed 'proof of intent'. That proof comes with price reversing back above the fence, triggering a 2nd gNomonic target, with follow-thru completion of both price levels. It is important to note that when using this gNomonic xPansion structure, the lion-share of profit is made trading (in a directionally biased market) from the mirror zone to the bumper 108 level. Example can be seen in pic 2 at 9:43. Price provides a time relationship entry, and entry here is specifically trading for upside to continue with move to bumper level. The 10:08 mirror level entry shows a textbook entry example with target in play and directional fence alignment.
Remember This:
The stats of this gNomonic targeting show that over 4 days of
trading there were 91 cycles, 60 of which were positively biased and triggered upside targets. Of those targets, 92% completed within the time frame of 4 cycles (360*) . . . 36 in 1st cycle_60%, 7 in 2nd cycle_12%, 9 in 3rd cycle(270*)_15%, 3 in 4th cycle_5%, and 5 failed to complete within 4 cycles_8%.
Lesson: Even targeting having a high completion rate over time will fail consistently. Do not get married to targeting despite the stats. Entry with Max-Reward and Min-Risk is what produces profit and these set-ups occur over and over again. Set up your charts to show these relationships as demonstrated . . . be patient for entry . . . stop-out if the price-time relationship fails . . . because directional bias of a different fractal is no doubt taking over.
and remember . . . target failure is always an option. A target just represents potential. The previous gNomonic targeting examples have demonstrated 3 things:
1.) Price is consistently retracing from intent.
2.) Best entry for gNomonic targeting is in the mirror zone with alignment support.
3.) Momentum towards targets can be found as price applies into the FbTm_cr17 zone with subsequent move above FbTm_cr17 fence.
Fractals can be different chart size or different wave size on the same chart (as shown here). In this case the positive directional bias is using a 4 wave while the negative is showing the 3 wave. Details on the selection of these settings can be found elsewhere.
The dynamics of the wave size selected can be significant. In the next pic you can see that using the 3 wave for the positive bias picture had perfect completion of the target at the high, with the subsequent perfect turn being caught by the same 3 wave directional bias reversal and negative directional bias mirror zone showing red.
So why would I use the 4 wave? . . . you might ask. The answer is that the 4 wave, in certain markets, provides more targeting with retracements, and more retracements with good completion stats, means more trade entries with good reward to risk opportunity. This is especially rewarding in commodity markets such as crude oil, which is depicted in these examples. Combining the 4 wave upside targeting with the 3 wave downside reversal possibility can work well as shown . . . but takes observation over time on your part to 'make it your own'.
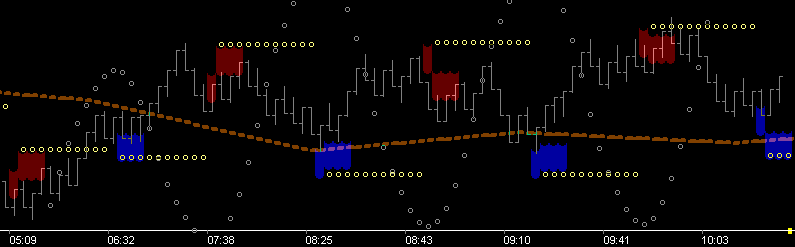
The MASqrA dll is a legacy tool that is non-wave based. gNomonic Balance Point is used as the threshold of crossing between Base of Positive Square and Top of Negative Square. Set-up and sized properly for a market fractal, users will find consistent price follow-thru to the ET point of the square. This is the white dot level in the positive square and yellow dot level a negative square. Price moving above prior squares 'ET' level or prior squares 'top of square' level is extremely positive as seen in this pic.
Shown in this 1st pic is a small fractal square which is .108 Geo Mercury. The 2nd pic is .618 Sun/Earth.
In general . . . don't trade against price action at top/bottom of a well tested square.
Price spends the majority of it's time bracketed by the wave of vibration. In it's journey through the wave, price is projecting a map of the future, creating a storyline if you will (the 'Tale of the Tape'), that predicts where the significant events of the future will occur. For you to trade successfully in real-time, it is necessary for you to internalize the significant 'event' components of this map, so you can read the story of price (the 'tape') to yourself, as it unfolds. You must become a 'Tape-Reader'. Developing the ability to read this map/story is a building block process. The 1st building block is the Fold-Over Point (Level) of the Time Fence.
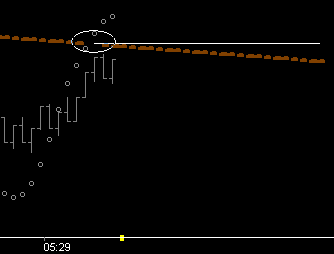
The fold-over point of a time fence is the anchor point where the next leg of the fence will start from. Shown here is the Crest Tm21 fence. The 21 point in time occurs strategically each wave just before the turn of the wave. In this case price is below the fence, indicating the fence is going to turn down. Two things to learn. The fold-over level is current resistance, and since the fence is going to fold down in this case, the next fold-over level may be below price. If it is . . . that level will be support . . . right up until it is not. (Note: price below crest fence is negative so any support provided by the new fold-over level is only temporary unless price can break above the current resistance level)
1 bar later the wave turns (crest) and the next leg of the crest fence is now known. Price is bracketed by these fold-over (Time/Price) levels as expected.
As shown, the Burton MTR_AUTO dll displays this information . . . this structure, as a trade 'zone' . . . a price bandwidth based on the fold-over level of two fences. Output here is only showing the support level (blue) of the crest turn (the above force). You should notice that the prior support level had red overlaid on the blue (automatically) when the support level failed (red over blue = purple). When support zone is broken it becomes resistance. This is what tape reading is all about . . . knowing where these levels are. Burton Cycle Tools shows you both Where . . . and WHY they are.
So the stage was set for the possibility, the move above crest Tm21 fence invokes momentum and the follow thru runs price right up to the 90* price target which was triggered and is shown here.
Internalizing the above information, making it your own, being able to read it clearly, is a first step towards understanding what you need to trade in sync with the position of price when price has set-up like this. However, this picture is incomplete thus far.
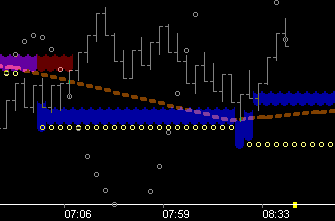
As the wave slows and prepares to turn, the resulting momentum compression can be measured and used to output a stop level to the trade zone (small yellow circles). It's when you know the risk of the trade that a larger degree of trad-ability exists. Notice in the pic that the prior stop level (which was broken with the earlier reversal), is holding price down going into the new support level. So this single side of the equation, this single force (the wave crest . . . the above), all by itself creates support and resistance levels. Support levels at time of new wave crest, and resistance levels when support doesn't hold.
Be sure to understand that this trade scenario depicted is trading for a price change . . . it is generally better to trade for price continuance following the change.
The move up at 7:06 had to break thru the Tm21 fence and the crest resistance of the prior cycle. Part of your understanding should be that the strength of this move demonstrates that stops were being hit. This is always occurring when resistance levels are broken through. Now price is on a journey above the crest fence . . . but the next key time, as far as this force is concerned, is the next crest, which comes at 8:30. At 8:30 it is essential to understand that price has done you an extreme favor by retracing to the exact fold-over level of the crest Tm21 fence. The exact level that held and ignited the 1st upside move. Price at 7:06 was looking back from this future time and using it for support. Now price is at time and has to make the decision for continuance or not, and trading for continuance is what you want to trade.
As long as price is not reversing the crest support level and staying above the Tm21 fence then you are looking for longs and expecting price to achieve the 45* price target. 9:17 produces the next continuance threshold opportunity at crest. Note: Reward/Risk It should be noted that reward/risk in this structure in this market is much better than 2/1 from best entry. Risk being ~ 13 ticks (to stop) with reward ~ 50 ticks (to target).
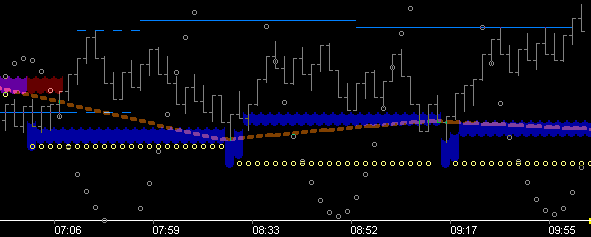
Summary: What you have seen thus far (learning will come with observation) is that price is on a journey traveling through the wave and that the crest of the wave (time) creates a support structure, a bridge or catwalk if you will, that can/will provide support for price to stay above if it chooses to do so.
Question: Are you thinking yet of what is missing from this picture? Is it obvious? Look at the pic again and focus on the wave.
Answer: What's missing is the trough force . . . the below. As you study the following pics you will begin to see why trading can be so difficult if you are not 'reading the tape'. Price is constantly being presented with the obstacle of the opposing force. And so it stops and thinks. Your job as a trader is to understand this and 'read' or 'listen' to the story that price is telling.
Look again now at that initial decision point we studied, but with the addition of the below force, the trough force resistance level. Now you can see that the decision zone (at crest turn) only exists because price managed to get above the stop level of the trough structure. What was resistance has become support. So price's retracement to the upside, rising into the shorting stop level (with rising momentum of the trough leg of the wave) and then exceeding the stop level, has taken price exactly to the threshold of change. Your immediate thought . . . 'price went out of it's way to get here, and is now in a position to break-out and run into the positive space above crest fence and run higher'. You understand that price is now supported by both the Long stop level and the Short stop level (which it is now above). It should make sense that the trough band width is missing from this pic, and if it were showing, it would be reversed, showing the purple level of reversal.
In summary . . . trading in sync with the natural law of opposing forces produces profit. Knowing where stops must be taken protects profit. Taking stops is easy when you know why . . . and have confidence that the next successful trade is just around the corner. The key component . . . . confidence in your time to recovery. Confidence in your ability to follow the market's vibration . . . because you can see and read it.
Once you have read enough . . . observed enough in real-time . . . have studied enough . . . to understand and internalize the relevance and clarity of the Phi structure of vibration . . . then you will embrace 13 as midpoint (.5). Which means that 17 is a time (.6xx) construct, and since there are two forces . . . the above (crest) invoking support, and the below (trough) invoking resistance, so then there are two time forces in play. In fact, it naturally follows that there must be duality in all vibrational constructs . . . time fences, fib fences, thermometers, gNomonics, squares, etc. The 2nd building block is the Fib-Level Fences of Time.
Filtering your trades using Fib17 fences as a 'Proof-Point' component to trade entry will put your trading and your mind in sync with the market. Shown here is the crest Fib17_21 fence (light yellow). The crest 17 fib-level is below midpoint 13 (ie a half-empty support for midpoint position), a key support contributor to any price move back to a bracketed position. Fib-Fences The fence (projected from cycle fib-level to cycle fib-level) can be constructed to flow through any point in time desired. As previously discussed, 21 is key for numerous reasons, but you may find 17_17 to your liking or 17_34, 13_17, 13_21, etc . . . that is up to you and will come with experience. In most cases, I choose 21 as the time leg of the fib-fence.
Learn This Trough Fundamental:
Price above Trough Fence(s) has upside momentum. Expect to see follow through to upside targeting. Price action to the downside is specifically a retracement into time/price thresholds . . . the point of continuance/change. Trade for continuance to the upside. Price will consistently bracket itself when directional bias is changing.
(Price above Crest and below Trough Fences is bracketed. Price will tend to find its way to the other side of the bracket once it is bracketed.)
Note: All retracement thresholds (proof-point relationships) are known well in advance. Patience is a virtue and will develop automatically as you understand time.
Learn This Crest Fundamental:
Price below Crest Fence(s) has downside momentum. Expect to see follow through to downside targeting. Price action to the upside is specifically a retracement into time/price thresholds . . . the point of continuance/change. Trade for continuance to the downside. Price will consistently bracket itself when directional bias is changing.
(In most cases, the smaller fractal chart(s) will forecast what the larger fractal is getting ready to do . . . continue vs. change.)
Note: I use Blue derivative colors (Cyan, Green, etc.) to show Trough features and Red derivative colors (Brown, Yellow, etc.) to show Crest features. Users can of course use whatever colors they prefer.
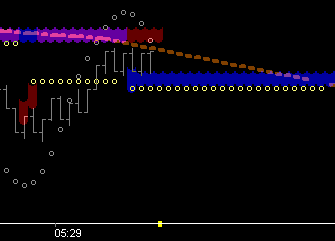
Reviewing this set-up once again . . . the price bracketed zone included move above the Crest (cr17_21) fib-fence (light yellow) just before 6:23 . . . any move up would be breaking out above TROUGH (tr17_21), invoking momentum upside 7:06.
We know what held the upside . . . if you don't you need to review the 'Trail of Opposing Forces' chapter . . . but we now also know that downside price action is retracing into time in an upside momentum space . . . and now we can also see we have a perfect crossing of Crest and Time 17_21 fences, ie, a TIME TIME TIME RELATIONSHIP. This is a big level and timing point. Trade That!