Wave Principles

The Law of Vibration is a sequence of events which unfold as described below.


<%EXTOGGLE%> Wave


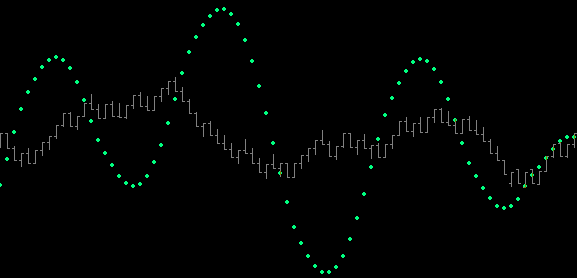
Any object vibrating will produce a wave as a function of time. That is to say, all vibration produces a wave form . . . momentum up . . . momentum down. Price vibration in the markets produce a consistent wave with a wavelength (period) of 26.


wav


Note: The market wavelength of 26 will be found to be meaningful as understanding of the .5 damping wave, the 180* cycle, Phi count time, and the 45 Time/Price threshold is developed.  


<%EXTOGGLE%> Opposing Forces


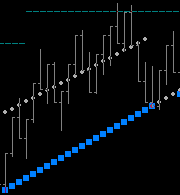
Wave forms produce opposing forces. The duality of [+] positive and [-] negative forces manifest (can be seen) in the damping waves which trail the primary vibrational momentum wave up and down.


dampwavup

Rising [+] Damping Wave

dampwavdwn

Falling [-] Damping Wave


<%EXTOGGLE%> Friction


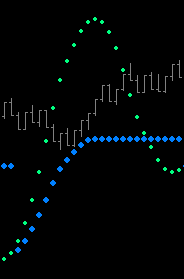
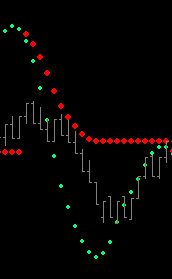
Opposing forces produce friction as the momentum wave is penetrated. This process slows the momentum wave and eventually turns it . . . serving to perpetuate the wave.


frictionup

Friction Zone [+] (Below)

frictiondwn

Friction Zone [-] (Above)


Note: The friction zone pictured here (a.k.a. SwtSptZn) is the .9, .707, .666, .618, .583, and .5 friction of the .5 damping wave.


<%EXTOGGLE%> Time


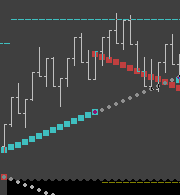
Friction creates a shock point of change (slowing momentum) which is new origin @ .707, the Sacred Cut of the damping wave. Time is this new origin point.


timeorgblw

timeorgabv


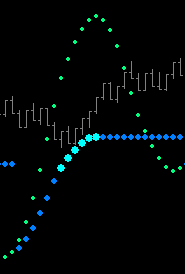
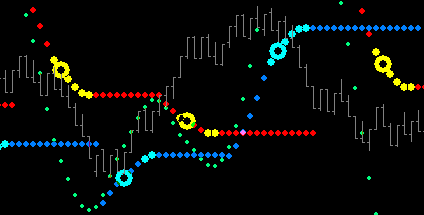
Viewed together . . .


tmorgabvblw


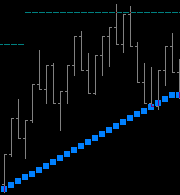
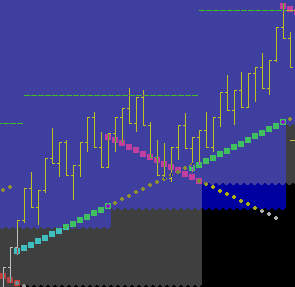
Note: From left to right . . . Price below Time is negative. Price above Time is Positive. Price above [-] Time is extremely positive. Price below [+] Time is extremely negative.


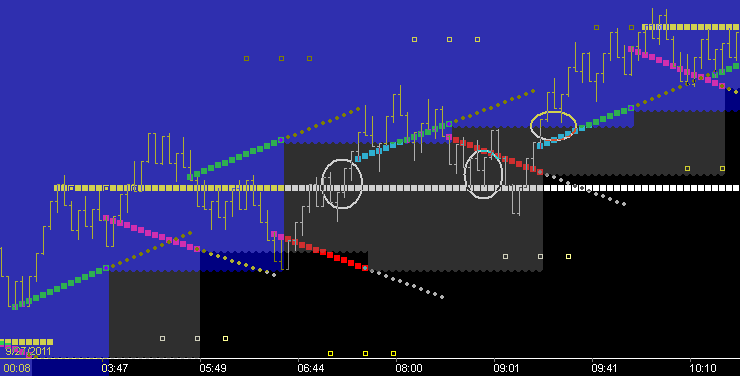
Notice in the above pic (from left to right):

1.Is price rising at [+] Time and rising above prior cycles [+] .5 level (blue) (ie 180*)?

2.Is price breaking above [-] Time and breaking above prior cycles [-] .5 level (red) (ie 180* and 270*)?

3.Is price dropping below [+] Time and retracing to prior cycles [+] .5 levels (blue) (ie 270* and 180*)?

4. Is price likely to find support at these prior levels?


Logic: Since the answer to 1 and 2 is yes . . . the answer to 3 must be yes.


<%EXTOGGLE%> Price


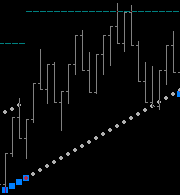
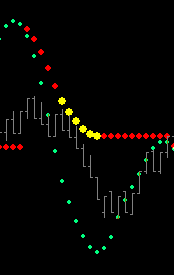
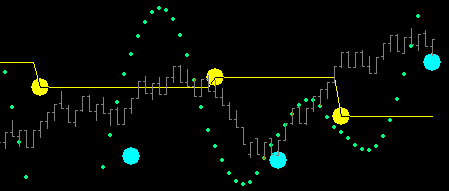
Time is also price at origin. While origin is beginning and Phi flows from beginning (which sets up Fibonacci structure in the future both as Price and Time), price @ time marks significant horizontal price levels that come into play in the current cycle, next cycle (180*) and the next (270*).


pricescut

Price level of [-] SCut Time


Though not shown above . . . notice the support of the prior cycles Price level of [+] SCut Time (cyan).


pricescut270


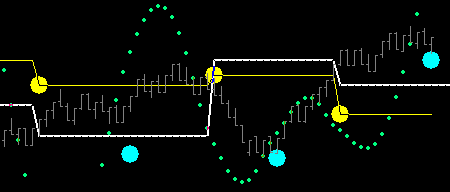
The 270* SCut level (white above) is exceptionally significant. Notice the effects above when tunneling either the SCut level or the 270* SCut level.


pricemdpntblw


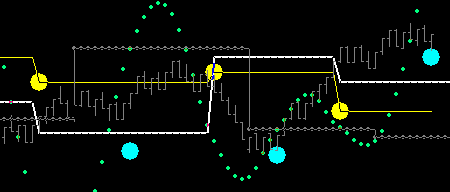
A 3rd level of significance is the extension of the .5 level of the rising [+] damping wave from below, shown above in grey. As an extension of the prior cycle, this level is the 180* look back to positive midpoint of the prior wave. Any significant positive price action will be above this level. As shown above, unless breaking out, price spends the majority of its time bracketed by these levels.


pricemdpntblworg


Above pic clarifies the grey level as the extension (180*) of the blue friction level marking the .5 level.


<%EXTOGGLE%>Threshold . . . Time/Price


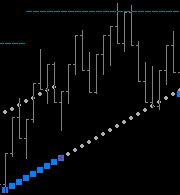
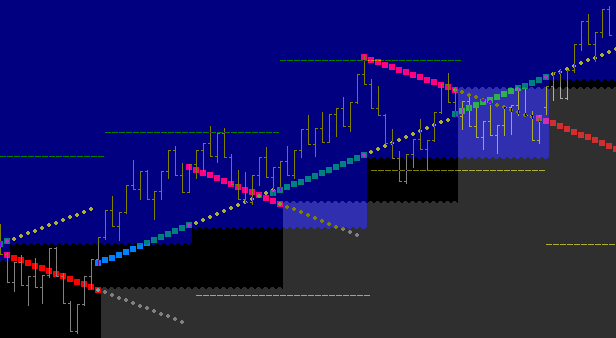
From Price @ Time (friction point) comes threshold. Threshold is the action state of Time/Price found in the future as the effect or reaction to the friction point generation of origin.


  Consider This:


where 'Time' is known . . . Phi abounds


If Fibonacci (Phi) is not found from beginning . . . you have neither Time nor Origin.


Since time flows from origin then each step in time has a relationship with price, i.e. time over price, and thus is born the vector. In this case, a friction vector. Specifically generated by the self-perpetuating wave of vibration. These vectors and other primary directional bias information are output with the mWav_TrdFltr dll.


frcvec1

The friction vector has a run-rate determined at origin by the price action of the cycle. The vector extends out over the lifespan of the cycle, (i.e. 26 bars). This phenomena of vibration produces a 'square' environment. The dashed darker cyan line seen at the top of the pic is 45 units of time projected at this cycles run-rate, and is a common 'stop & think' point of any cycle. Common resting points of time/price are 13, 21, 26, 34, 45, 52, 72, 90, etc. Also seen in this pic is the previous cycles Tm45 level.


frcvec3

During the course of a cycle are many timing points of interest. In this pic the dll has been set to Tm3 threshold. This threshold is marked by the last little blue square in the vector. So what is price doing at the 3rd bar of the cycle  (Note: Origin bar is zero)? One can see that applying into 3rd bar, price found resistance at previous cycle's vector (grey dots at left-middle of pic). Then at Tm3 price pulses higher, pausing somewhat close to Tm45 level of previous cycle.


frcvec8

In this pic we see price again pulses higher at Tm8 threshold.


frcvec13

And at Tm13, midpoint of cycle, price pulses again, on up to the Tm45 level of the cycle, where it rests and retraces all the way back to friction vector.


[I will point out for all that the top here is coming at Tm17 which is the .666 point of the cycle. This (you will find elsewhere in this help file) is the key to vibration . . . AND SUCCESSFUL TRADING.]


frcvec21

Landing at vector precisely at the Tm21 threshold, where it finds support for a bounce.


Pertinent to discussion here, (because it is covered elsewhere in this help file) is that .3 and .7 points of any cycle are significant. This equates to Tm8 and Tm18. Both will be found to be thresholds of action.


Maybe you're thinking, "isn't that picture a very filtered selection for it's perfection?" Absolutely! But the starting point for understanding vibration is to know what perfection looks like. And perfection is relative. In the above example price could have retraced to the friction vector at Tm3, Tm5, Tm8, Tm13, Tm17_18, Tm21, anywhere. Any bounce at a time threshold with follow through would be perfect. Any failure at any of these thresholds would be 'perfect'. So it may seem that perfection has nothing to do with the reality of trading in real-time, but that is not true. Once you embrace or understand the core tenets of vibration, the precepts of squares and XPansion, then you are free to look at a chart, see what price is doing, (ie. 'Read the Tape') and once you know that then you know what price 'has' to do next to either continue doing it or change.


English please . . .


It's easy to point to thresholds in hindsight and analyze perfection in it's many forms. Successful real-time trades will only occur when they are taken in sync with momentum and 'risk vs reward' at entry is known. So what separates a winning trader from a loosing trader is only one thing . . . the trader's approach to directional bias. It's funny that the most successful traders of the past have all been Tape Reader's. For our purpose's here we will sum that up as "Is the market making higher lo's_higher hi's?, or NOT!"


If it is? . . . for trading purposes then, we need to know the support level(s) for that action to continue or fail.


If it isn't? . . . then we need to know at what price level (and when in the future, ie. Time) could that price action possibly start.


Stop laughing for a moment and understand . . . that's all you need to know. And the answer is found in prices position relative to prior cycles crest and trough time levels.


frcvec13

Above we looked at this picture at left and spoke of it's perfection. Is it enough information to trade successfully? The answer is no, because there is no prior cycle 'time' relationship shown.


But this is . . .frcvec13clr1_zoom20 . . . or this . . .frcvec13clr3_zoom20


Adding prior trough time support (blue) clarifies buy zone. Adding prior crest time support (grey) further clarifies buy zone.


frcvec13clr2_zoom61

Nothing is more positive than being above crest time, except for being above both trough and crest time (light blue created by the overlap of dark blue and grey). (ie. price is in position for putting in higher trough and crest time levels)


When the market is in this position . . . risk of any geometric precept entry (ie retracement entry) is easily measured as the distance to price falling below these time levels (ie. loosing momentum)

< (click image to enlarge)


frcvec13clr4_zoom40

Over time I have come to prefer the long threshold shown as upside blue on the chart and the short threshold as downside grey . . . an overlap zone of light blue (for me) represents a consolidation (price is above trough time while below crest time) and is waiting for decision at next time threshold. Users may of course select their own preference.

< (click image to enlarge)


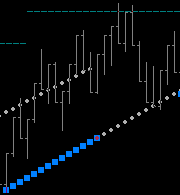
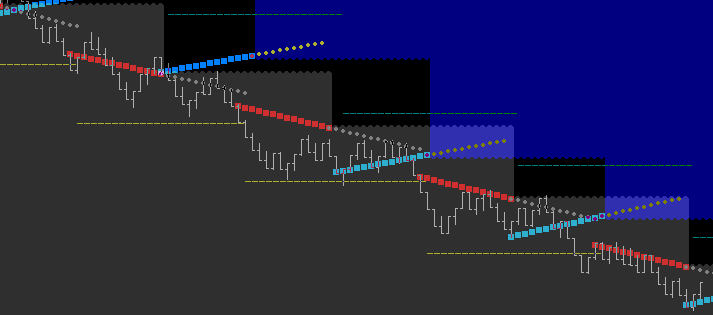
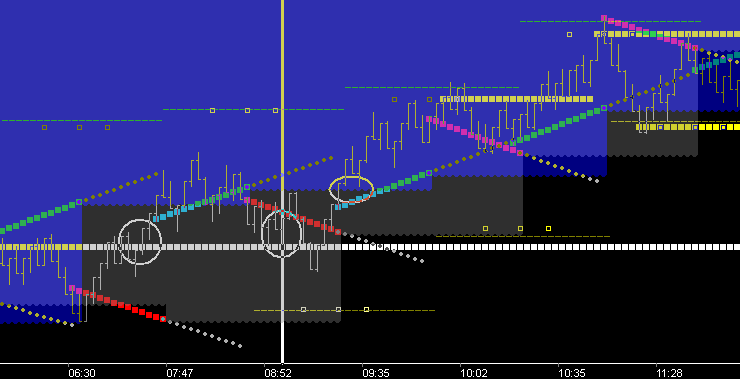
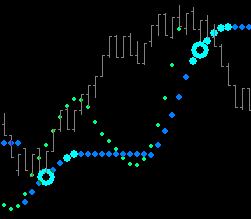
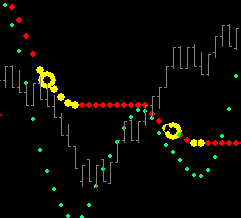
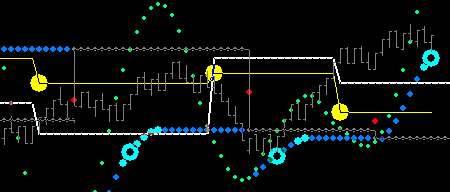
And the opposite is true when price is not in a positive position. Just like in a rising market, retracements in a falling market move consistently to Time Level threshold. That is what price does. The question is whether you know where these time/price thresholds are?  So risk of any geometric precept entry at retracement is easily measured. Remember that a market that is completing downside XPansion targets, is not positive. (click image below to enlarge)


trdfltr1_zoom40


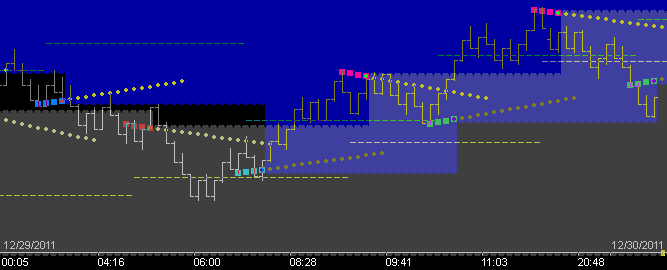
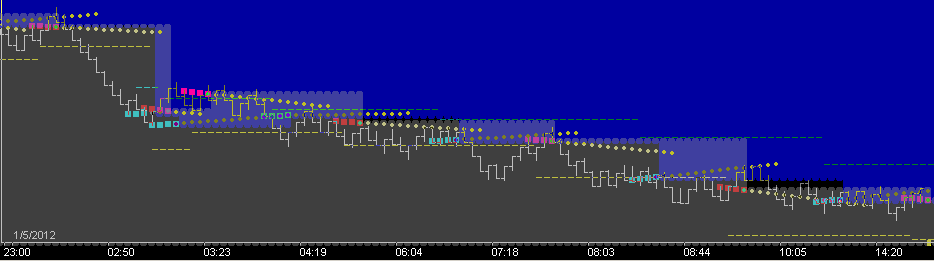
Trading for continuance (the correct action) will take a loss if things change. Judging whether any particular retracement to time level threshold is likely to break through and change the momentum direction is most easily anticipated by following a larger fractal. The below pics follow the Euro thru 2 days of momentum trading. See if you can see threshold entries, wins and stops.


trdfltr2_zoom25trdfltr3_zoom25trdfltr4_zoom25


And finally, let's review the earlier Crude chart which we labeled as perfect. Let's see what was happening on either side of that 'perfect' cycle. Before you read below, study the 1st chart below and make a list of everything you know about what you're looking at based on the earlier XPansion discussions and the current Time Support discussion.


trdfltr8_zoom25trdfltr5_zoom25trdfltr6_zoom24


Pics above:

1.Notice there are 3 circles I have added to the chart. Circle 1 is the time I generally start trading each morning. This 1st look at the market each morning tells me everything I need to know to trade successfully. I can see that at midnight the market was above [+] XPansion level, above both crest and trough time levels, and price moved up from there putting in a 2nd XPansion level from trough. I can also see the move above this most recent XPn level came precisely at the Tm13 trough (~3:47). Readers should note this is important because the opposite @ Tm13 is failure. Next significant event occurred when price did not apply positively into the Tm13 threshold just before ~6:44. In real-time price dropping during this approach to time is set-up for a perfect trade. It's a perfect trade even if it doesn't end profitably because it is a retracement to threshold in a market with known momentum direction. Logic: you can't complain about not getting a retracement entry and then not take the entry when the market gives it to you. Moving forward to the 1st circle where I actually have my charts running and ready to trade, the market is above XPn level, nothing but positive. Any move below XPn level is a stop for a potential move to crest time threshold level (grey/black). The 2nd circle is time where the crude 'Pit' opens. As this time approaches I am totally cognizant of the major threshold that exists just a few bars ahead, XPn level and crest time at the same level. Below XPn level at this time . . . the black Abyss, and crude is going to be moving fast. It is a set-up for perfect trading. This level has to hold with price moving on up above the trough time level (blue), . . . or not. This is little risk, big reward.

2.I've marked the pit open with a vertical white line and added the Tm45 levels. Now we can see that two cycles have elapsed with price coiling in the crest time support zone and no Tm45 levels hit. A move above support @ trough (which would be rejecting the Abyss) should find it's way to Tm45 . . . which it does. The 3rd circle marks the start of that 'perfect' cycle from our example above. Note: when price is vibrating 'perfectly', consider it a sign of program trading, and you should also consider that program trading doesn't turn off and on easily. That is why it is foolish to try and short when price is in this position.

3.XPn continues throughout the day until 15:00 (marked with a 2nd white vertical line). Several other decent thresholds provide retracement entries. I've added the contra XPn levels which should add a good deal of clarity to the retracement entries, and the overall vibrational structure of the day.


Did you notice . . . by the end of the day price had completed 3 separate Tm45 price levels quite precisely. You'll do best to trade in sync with this kind of price action. Use this knowledge of price structure to profit from: (1) retracements to key levels in advancing markets, (2) breakouts beyond XPn levels, (3) price accomplishment of Tm45 levels.