BTS9_MTR_AUTO

Contents
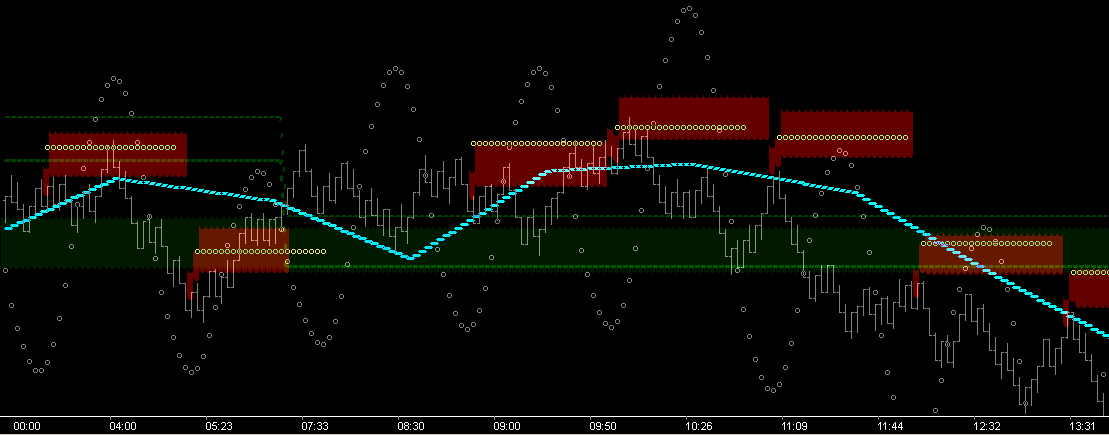
Momentum Tape Reader Auto (click pics to study) [showing: Trough (generated) Resistance Zones with Trough dBias filtering] |
The MTR_AUTO dll displays the resistance/support zones of the market generated at each turn of the wave. Directional Bias output is selectable by user, using any Price/Time Fib Fence desired.
Trough Mechanism: When broken, the resistance zone becomes support. These reversal zone bandwidths consistently define the bracketing levels of future price action, setting the stage for clearly defined retracements to breakout levels.
|
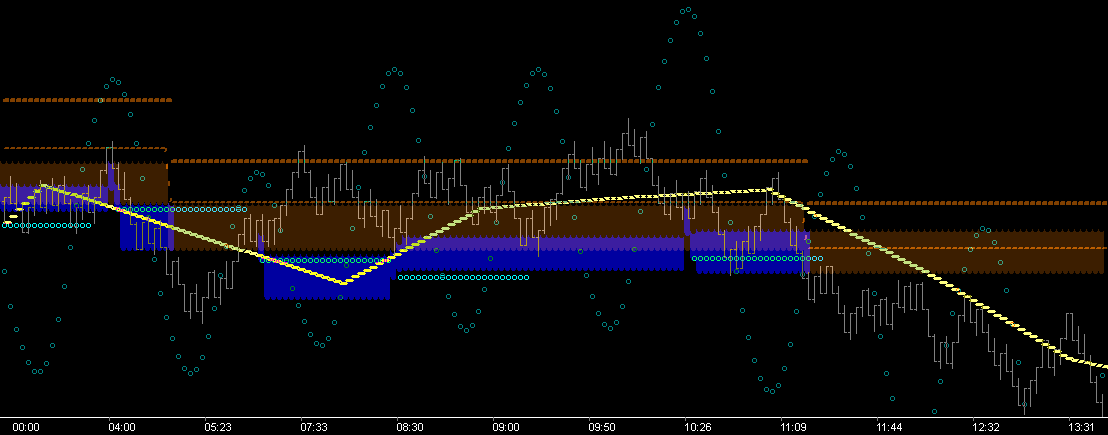
[showing: Crest (generated) Support Zones with Crest dBias filtering] |
Notice the dominating character of the Trough setting shown above, and understand . . . All structure across the Wave Crest dominates, both as resistance and 'breakout potential'.
Crest Mechanism: When broken, the support zone becomes resistance. A market (as pictured) that is merely retracing into prior support reversal zones, is trending down. Trading Fundamental As these pics clearly show, the nature of duality dictates that there is two sides to each of the opposing forces. It is much easier to trade the current state of a single force (and its boundaries) when you are 1st starting out. |


The MTR_AUTO dll can be set to display all of the following features from both Trough and Crest of the Momentum Wave:
1.Trough (generated) Resistance Zones (fold-over Price Levels of two user selected Trough Time Fences)
2.Crest (generated) Support Zones (fold-over Price Levels of two user selected Crest Time Fences)
3.Auto Directional Bias output filtered by user selected Fib Price/Time Fence (shown in examples)
4.Option to display Reversal Zone Bandwidth (ie what was support becomes resistance, etc.)
5.Option to display Reversal Zone Bandwidth at next sup/res failure (ie trend, continuance/breakout level, retracement target zone, 270*,etc.)
6.Time Fences: Trough, Crest or both
7.Fib Fences: Trough, Crest or both
8.Option to display appropriate Stop Level for each zone
9.Option to display 'Contra' Trough/Crest Timing Points even while dBias'd filtering is chosen.
10. Option to display the Momentum Wave
Remember This Fundamental of Learning: |
Each of the vibrational components of this Wave Based tool provide a unique 'Squared' and 'Phi Rich' structure to any chart. Successful trading comes when two things are understood:
1.The structural RELATIONSHIP of the above features (specifically created by price action) and . . . 2. Price's position in 'Relation' to this 'RELATIONSHIP'
It is suggested and highly recommended that users add only one structure and concept to their trading at a time. Complete clarity of the trade precepts (action points) of each must be understood and internalized before a 2nd can be added successfully.
Observe . . . find what you like . . . observe . . . what speaks to you . . . observe . . . make it your own . . . use it.
This help file is about helping you accomplish that . . . review these charts often.
|
Learn More: