Square Principles

Contents
Our purpose here is to keep this as simple as possible and specifically explore the aspects of the square structure that provide clarity for successful trading.
The mSqrXL dll presents the square on the chart as the 1x1 arc. (shown below)
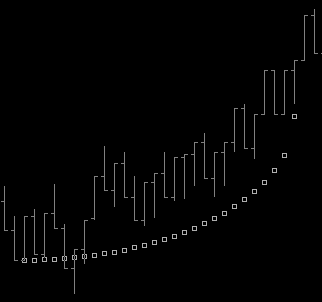
The 1x1 arc is the quadrant arc of the square, i.e. the chordal deviation of the 1x1 vector of the square. Top of the 1x1 arc is top of the square.
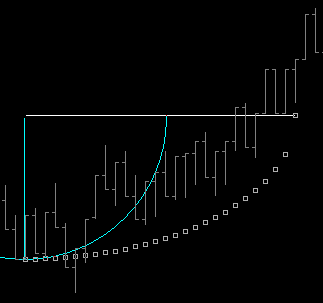
Your 1st thought might be that, 'it doesn't look square', but it should be understood that this is in fact the problem with normal graphics and specifically charts in general. Nothing is actually 'square'. So the mSqrXL dll automatically 'squares' the bar range of the chart mathematically. And the circle drawing tool shown above (cyan arc) can be used to demonstrate the absolute square of this arc output by the dll. (shown below) The arc now 'looks' square when the graphics of the chart are stretched to match the circle tool, but in fact the arc was mathematically square all along.
|
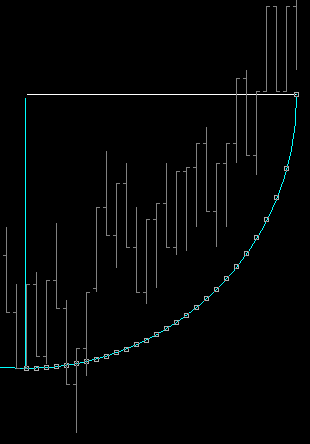
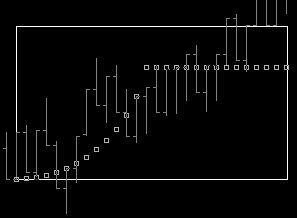
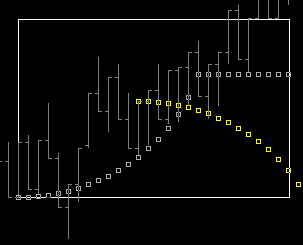
While price is in a positive square . . . expectation is that price is highly likely to find its way to 'midpoint level' and on to the 'top of square' zone. Why? Because the momentum wave structure of price vibration is a self-perpetuating action/re-action state of price over time.
The 'top of square' zone is specifically the 'vertical' level of the arc. This vertical level is the level found at the final point along the arc that is one step from end of arc, i.e. the point where the arc goes vertical. So the 'vertical zone' is the zone from 'vertical level' to 'top of square'. In the above picture, mentally draw a line backwards from the 'vertical level' and you can see that price held at ~ this level for 13 bars, before moving higher.
|
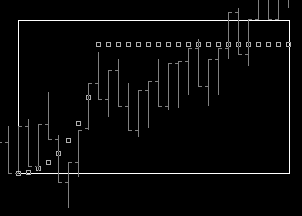
So a square has a beginning and an end, with numerous points of interest along the way. And a major point of interest is the midpoint or .5 point of the square. This can be shown by changing the arc to the .5 fractal.
Internal or Fractal Arcs have a unique characteristic as shown above. Mathematically, the final step (the vertical point) creates a divide by zero error and stops computing. While this would be easy to fix, it proves more significant to leave as a horizontal which is then marking the 'vertical level' nicely. By looking back at the previous pic you will notice that the .5 vertical level is pretty close to the 1x1 vertical level.
|
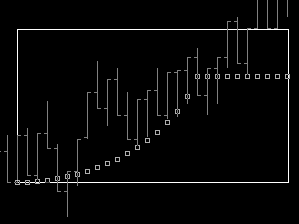
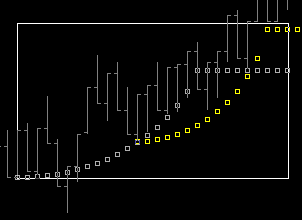
A price move to 'top of square zone' early in the square tends to stall or stop and think. Why? Because this zone is the 'Squared' price target of the square and if early, price is ahead of time. So another major point of interest is the .3 fractal arc.
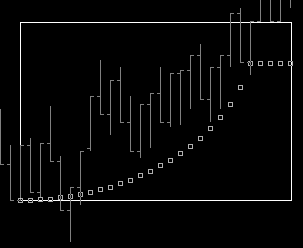
Notice the vertical level of the .3 is higher than the .5. (shown in previous pic) This particular arc functions nicely to capture price consistently, both up and down, and so the .3 vertical level is a significant level to watch for direction change or continuance. Doing the simple math one can see that the mirror of .3 around the .5 midpoint would be the .7 arc.
As price applies into midpoint and beyond the later fractals can be telling.
|
![]() MidPoint . . . the significant event
MidPoint . . . the significant event
Burton Cycle Tools function based on the Momentum Wave formation that is found in all price vibration. The square we have been discussing thus far is the positive square which finds origin at the trough of the wave. Because of the wave formation, midpoint from the trough is crest, and thus it is at midpoint positive (i.e. wave crest) that the negative force is introduced.
The question then becomes . . . Which force will dominate or takeover? Price action in the above example is quite clear as several 'perfect' threshold entries were available (can you see them?) . . . HOWEVER, this is easily seen in hindsight. In real-time, threshold entries like these are a dime a dozen. Picking the ones that have follow-thru (as above) is at the crux of successful trading and what this help file is all about. Trading in the now, REAL-TIME.
|
Breaking beyond the Crest arc early, or breaking beyond the Trough arc early, is significant. Why? Because in essence the 'Square Origin' bars, both Trough and Crest, are timing bars. While the wave momentum at Crest may be down, and vice-versa at Trough, a divergence at these times will follow the path of an inverted or Contra arc.
It is important to understand that switching the Crest or Trough arcs back and forth from Momentum to Contra is not done in real-time. It is being shown here as an emphasis on the fact that both the Crest and Trough origin bars are timing events and; (1) a break of the Crest Momentum arc is significant, (2) that there is an underlying contra structure at each square origin, whose force will manifest as a break beyond the standard.
|
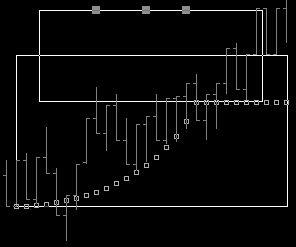
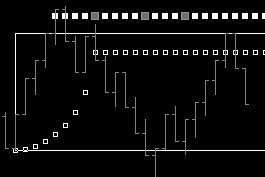
Price movement beyond the top of square enters the realm of expansion, expansion into the octave. The octave is a mirror zone of the square. What exists in the octave is the same fractal arcs found in the square but these arcs are projecting down from the top of the octave, and they have the same vertical levels found in the fractal arcs of the square. So these vertical levels in the octave zone are essentially the vertical level of the square fractal arc mirrored around the top of square.
The mSqrXL dll shows these vertical XPansion levels as 3 markers in the octave zone (grey in the above pic). They are located at .3, .5 and .666 points in time. As long as price is in the positive square and showing strength, i.e. breaking above Crest arc, the mirrored vertical level is the target of any move beyond top of square. It can be a significant 'stop and think' level for price.
Especially when the hit of this XPansion level; this Octave Mirror, this External Opposing Force Vertical Level, is hit early in the square.
|
An early hit of external vertical level will generally fall back below internal vertical level at the .3 point in time. Why? Because a move like this is generally taking stops, is advancing at a run rate of 8x1, which subsides easily, and price is way ahead of time.
|
The only thing standing between you and successful trading is understanding when to trade these precepts. And that understanding lies very hidden in the concept of vibration. Vibration consists of a sequence of events which include; the wave, opposing forces, friction, time, price, threshold, and fractals. None of these trade-able on their own, but together over time they produce a relationship that reveals the 'state' of price, the 'Directional Bias' if you will.
Once a favorable relationship of these vibrational components is achieved, i.e. alignment, it is then and only then, time to engage the precepts of what price should or is likely to do. Why? Because price threshold can only be traded with expected positive outcome when price has a relationship itself with the correct 'structural relationship'.
Example: A market that is achieving upside XPansion levels (i.e. external verticals) is a positive market. So when you start the trading day the question is: Where is price? Is it above [+] externals or below [-] externals? Or is it bracketed by both?
|
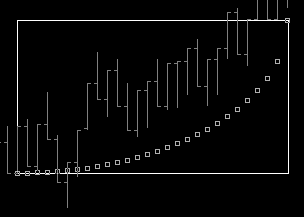
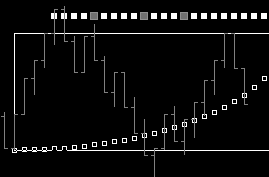
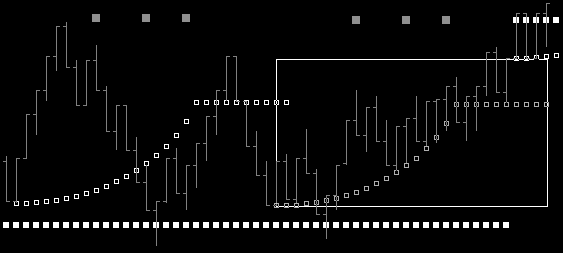
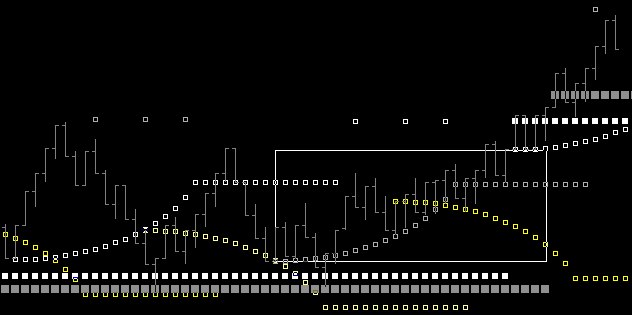
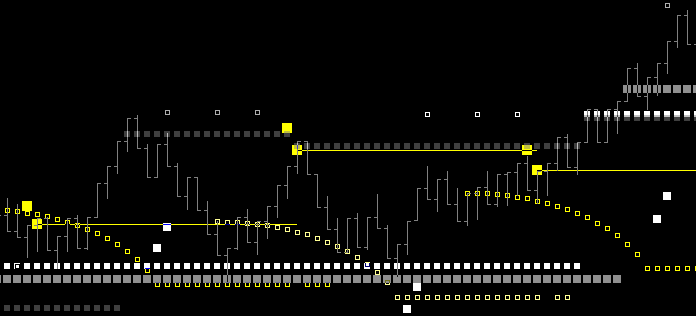
If price action is in a position above [+] XPansion levels from a prior cycle (white horizontal squares in pic below) you are looking for longs at trade thresholds giving good reward/risk opportunity. Why? Because pullbacks in this structure are retracements in a positive directionally biased market, i.e. higher lo's are being made.
Remember that the various fractal arcs produce slightly different vertical levels. Over time I have found the .5 to be very consistent in providing XPansion levels that are consistent and mean business. Notice in the 1st square above the .5 external (grey squares) was missed by just a tick or two while price was in fact hitting the .3 external as shown below. The result is basically the same.
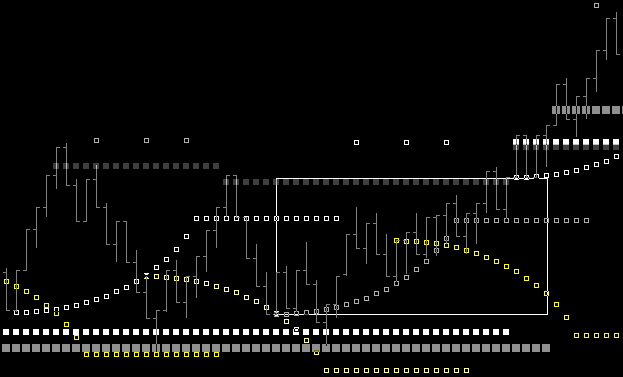
When price is above an XPansion level and a new XPansion is hit and price stops, then price is bracketed by 2 positives. This is the relationship environment for longs, BUT, continued upside must now 'breakout' above the next XPansion level.
|
As price relationship allows for entry, the best trades come as price 'applies' (steps into) threshold (point of continuance). Why? Because 'the market' recognizes and is the driving force behind this kind of price action, and you want to trade with 'the market'. Think of it as program trading. When program trading has kicked in or 'taken over', you will see very exact precision in adherence to the square structure. (as shown in the move below where price broke above the Crest arc)
Before proceeding make a list of everything you know so far about the trades and thought process in the chart above. Generate the list based on events from left to right. Also consider (in a separate list) what might be missing in the above picture?
|
![]() The List . . . what you know? . . . + Advanced Logic
The List . . . what you know? . . . + Advanced Logic
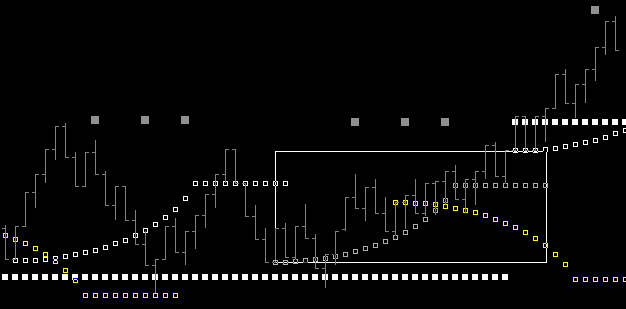
From Left to Right: 1.Price is above [+] XPansion and long precepts should be engaged on price retracement. 2.Break above Crest arc (yellow) is a Square Precept #3 long. 3.Price is very close to XPansion level and no doubt halting at the .3 external. 4.With this fast move early in square, Square Precept #4 is in play. I can take a tight stop short (contra-direction scalp trade) if price drops below the .3 internal, but potential reward here is quite limited. 5.As price is dropping below the .3 internal (Square Precept #4) I can see the XPansion level has the Crest arc internal level just below it (yellow), and from what I know, this has to be the last man standing for price to halt and stay above this XPansion level. i.e. BEST ENTRY for maximum reward to risk retracement trade. Price is at the .5 point in time, so where is the Crest arc? 6.Price steps into new square with essentially same entry opportunity as previous. Trading 1st hits is generally better. But this is still maximum reward to risk entry, AND, more importantly, early position in new square is upside momentum point of wave. 7.I can see upside of price is caught by the prior squares internal vertical level, and I know this level is basically the same as this squares internal. 8.That fact wakes me up to the fact that both of these squares found the same origin price level, which is right at XPansion support, so all of this price action is consolidation or 'coiling' for something to come. (I am reading the tape) 9.So now I am especially interested in the applying action of price because of this coiling and can totally anticipate further upside. 10. Confirmation comes with the break above Crest arc. (Square Precept #4) 11. Goal is to hold runner for upside XPansion break. 12. Exiting as price approaches next external vertical level.
And I (you) have a question.
Since the break above Crest arc is actually following a Contra arc from the Crest origin . . . Doesn't this contra arc have an external opposing force vertical level also? And shouldn't it also contribute to directional bias?
The answer is yes and yes.
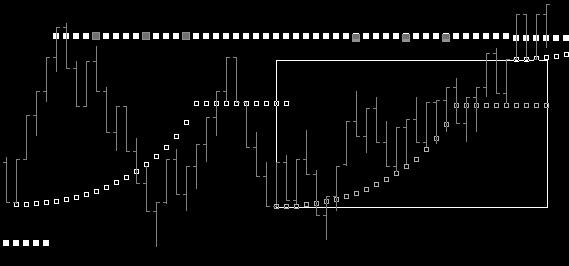
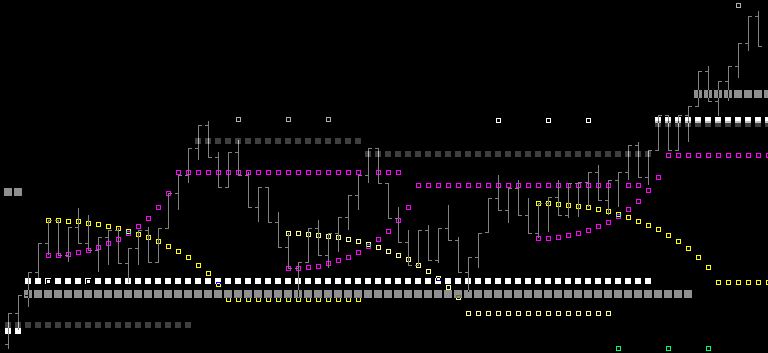
The above pic has the Contra arc 'achieved' XPansion levels showing in grey, adding further clarity to the support relationship for long trade entries. Also added to this picture is the missing Crest arc. It can be seen that the trade at support in the middle of the chart was also above this crest arc and positioned in time right at the vertical point of this arc. You cannot be long if price moves below this level. So this specific 'relationship' of price to structure is the best you can have. A 20 tick downside with 100 tick upside to XPansion level. (5 to 1 reward/risk), which does not include break above external.
Another interesting thing to add to this picture is the top of the contra arc.
I add this with a 2nd dll and set the contra arc fractal to 1. Remember a 1 vertical is the top of square. This has the effect of showing the mirror vertical level as the top of square, which it is. I add this as a smaller/darker grey because then I easily recognize when it shows up that price has broken the crest arc all the way to top of the contra square, and price needs to get above this level for continuation to occur. Example of that break above contra top is found at the end of the pic above. Notice in the rest of the chart this 'Contra Top Level' contributed to the bracketed [+]consolidation occurring prior to the breakout.
Let's take a step back for a minute. The above paints a pretty picture for me. But you have to make it your own. Remember: It was suggested and highly recommended that users add only one structure and concept to their trading at a time. You have to make it your own! Don't make it complicated. Make it your own.
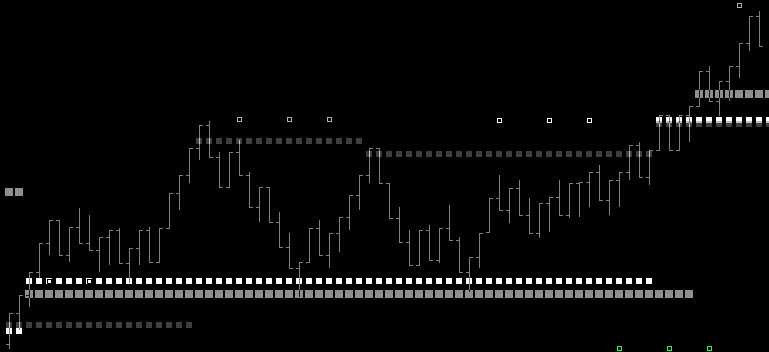
So what do you have to have? You have to have directional bias. So put XPansion levels on your chart. XPansion levels also provide the line in the sand that has to hold for directional bias to remain in tact.
So here's your basic chart. Marking XPansion levels is 'Tape Reading'. Burton Cycle Tools reads the tape for you automatically and outputs the key levels as described.
Take trades based on your own indicators that agree with this directional bias. Then add precepts that you like and that make sense to you. Example: If you like trading breakouts then in a positive structure as shown above, you want to trade the breakout of the Crest arc and in general, price above crest. Well, it's difficult to trade that if you can't see it.
You can show whatever structure components you want to trade. Make it your own. Shown above: Crest contra arc to top of square, followed by Crest contra arc to top of square, followed by Crest contra arc to top of square . . . and beyond. By definition . . . directional bias UP.
|
![]() Looking Back From . . . the next step . . .
Looking Back From . . . the next step . . .
The next step is studying 'Wave Principles'.
To whatever degree you have successfully internalized the relationships expounded in the preceding examples regarding square principles, when you start reading about wave principles your mind will automatically be recalling the many pictures shown above and described in detail.
At whatever point confusion sets in please be reminded again that this is an additive process. Each of these principles of vibration adds clarity to the total picture, HOWEVER, you do not need 7 points of confluence to trade successfully. The emphasis here has not and will not change . . . you should pick out what you like and make it your own.
Thus far we have looked at 4 of the 7 features of the mSqrXL dll:
1.Natural Square Arc projection 2.Fractal Arc projection 3.Contra Arc projection 4.XPansion Levels from Square and Contra origin
It is anticipated users will review here often for clarity of precepts and appropriate trade entry with regards to directional bias.
The remaining 3 features:
1. Sacred Cut Time and Levels 2. Time Fence 3. Break-Out Vectors
will be used in exactly the same way as the 1st 4 . . . that is to provide clarity to directional bias, momentum points (events) of significance, last man standing price levels, trade entry clarity, i.e. thresholds of change and continuance, i.e. retracement move vs directional bias change, etc.
And all of these will facilitate, over time with observation, having you trade in the right direction, at the right time, for the right reason.
So before your mind gets muddled with new pictures to sort out, let's review what we don't yet know.
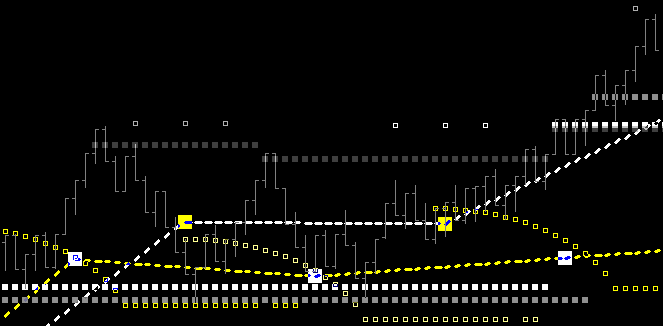
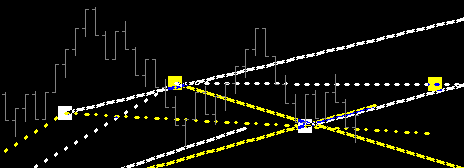
If you knew that in a [+]directional biased market (i.e. price above [+]XPansion Levels) that price breaks above Crest arc should have momentum (oh wait . . . you do know that), then you may want to know that price moves above the Crest Sacred Cut level (yellow horizontal), especially those moves occurring at Crest Sacred Cut Time (yellow marker w/horizontal), should be significant.
Or if you knew what you know about a [+]directional biased market, then you may want to know that price above Trough Time Fence (white dashed) is positive and/or price above Crest Time Fence (yellow dashed) is positive and, especially price above both Time Fences, Trough and Crest, is free to run, i.e. expand.
The above Time Fences (Crest and Trough) are set to Tm13. I find this to be a significant setting since it is marking the cycle midpoint in duration and nicely serves to qualify prices position, relative to the opposing force, as it steps into the next wave turn.
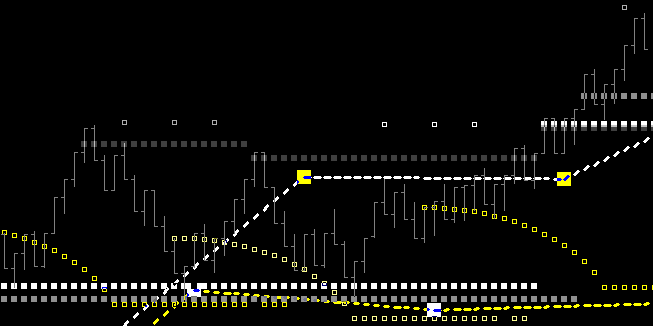
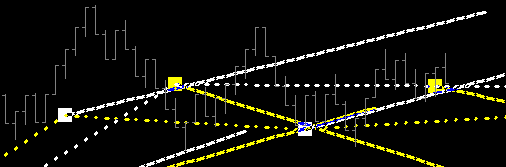
Now if TmFence13 (as a midpoint fence) produces significant results day in and day out, which it does, it should follow that a full cycle fence, i.e. TmFence26, should be interesting and prove significant on a consistent basis.
The Time Fences employ the vibration fundamental that where Time is known, Phi will abound. That is to say, if you have Time you have Origin. And if you have Origin, PHI MUST ABOUND! It has to, else you have neither Origin nor Time. Understanding this, then we can summarize that the previous time fence discussion and pics were demonstrating that these Time markers are significant because Phi is significant. And since they are significant it may follow that a vector trajectory from time, perhaps engaging the vertical level of the square, could provide further clarity to the trade structure.
And Break-Out Vectors do exactly that. Their greatest value is what they contribute in real-time trading. It's easy to look back at the chart and see what you should have done.
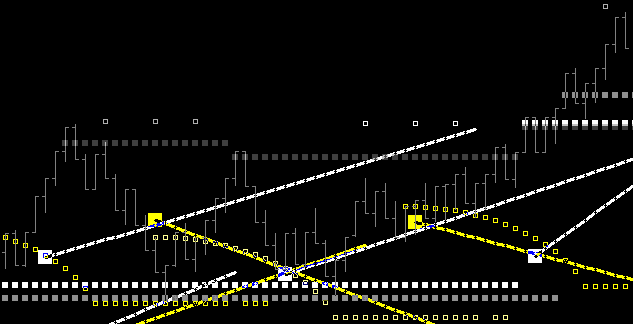
Consider for a moment if in real-time all you have is the above TmFence13 and the associated Vectors. The fact is, that's all you need to trade successfully. That last bar has gone all the way down to last man standing of this structure. And what do you know? You can see in front of price the next Tm13 marker (yellow). So you know price is applying into Tm13 Crest. Price only has 2 choices. It can close below the yellow vector and Crest TmFence, and begin a journey down, diverging from Tm13 Crest. Or it can hold here and begin to rise into the Tm13 Marker. Precepts tell us it is much more likely to rise into Tm13 and maintain upside . . . and the trade opportunity is at max reward/risk. Or you can wait for price to 'prove' itself by moving above the vectors right above price. Either way what you can not do is short here because this support may fail. That is not a trade.
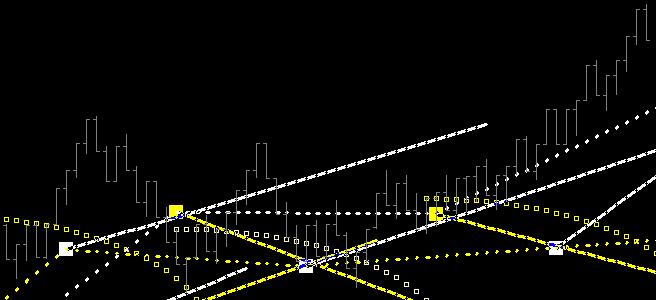
And price moves on to the next threshold of Time, giving the same decision process, but now price has to break above the Crest arc, which is why we call it the Break-Out Vector. These vectors consistently provide a precise crossing point of the arcs for a break-out to occur, and these crossing points are completely non-linear.
|
Ponder the above . . . Observe. Review the above and Observe. Sort the above into what speaks to you and Observe.
And when ready, we continue . . .