Why Tape Reading?

Contents
I mean . . . Why MTR? (momentum tape reading)
You can follow as many indicators as you like but until you apply them with a knowledge of the current Position of Price$, it is most likely you will not be successful in trading.
Position of Price$ means in part:
➢ Where is price . . . at Time? Maybe better said . . .
➢ What is price doing in route to time or applying into time? And . . .
➢ What does price have to specifically do to either change or continue the present directional bias?
Answer those questions and you can trade successfully.
➢ Why? Because you understand the 'Position of Price$'.
Typical elements of MTR are discussed below.
When lower momentum highs are being put in . . . expect lower prices.
|
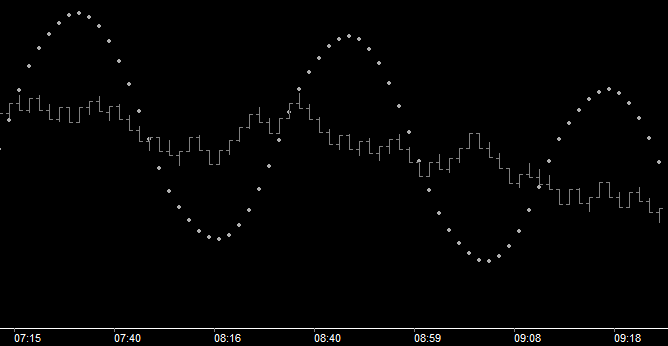
When higher momentum lows are being put in . . . expect higher prices.
|
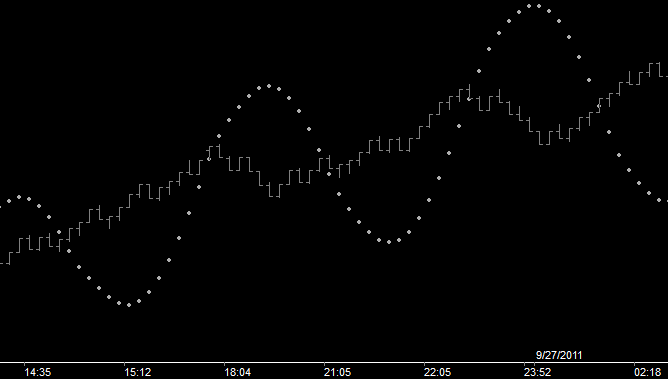
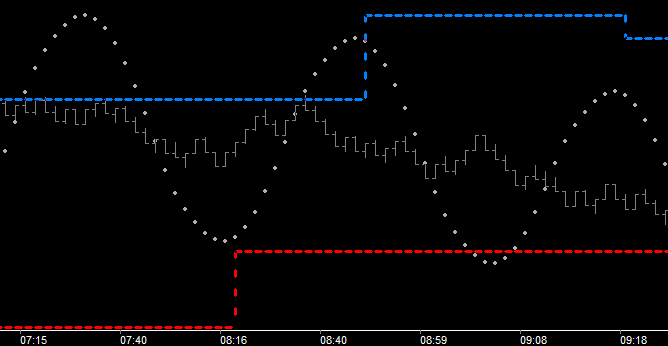
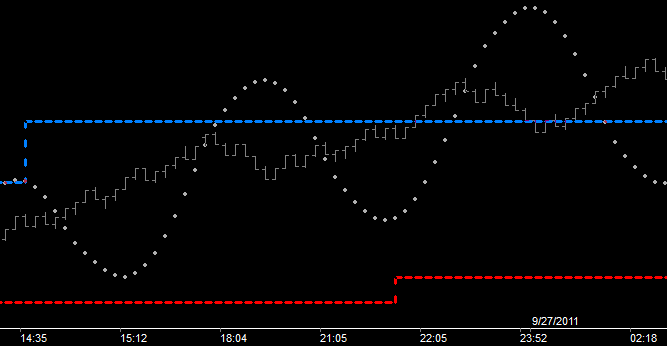
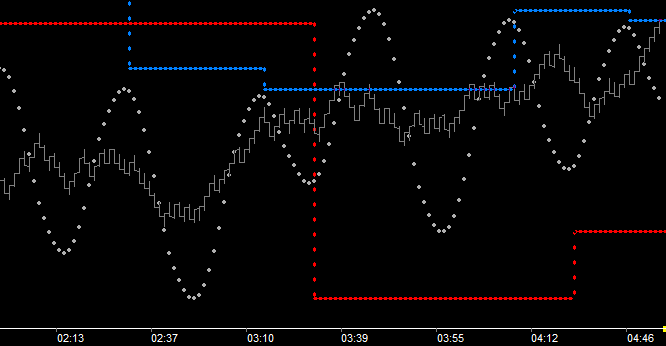
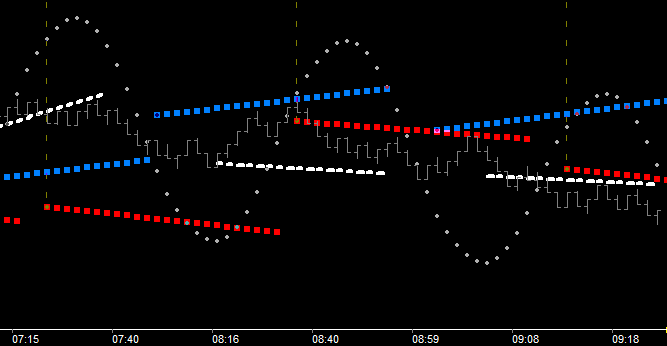
Price spends the majority of it's time bracketed by the 'Last Lower Hi' and 'Last Higher Lo' levels (shown below in blue and red).
Price breaking beyond either LHi (blue) or HLo (red) levels is a breakout . . . significant . . . and not easily accomplished.
|
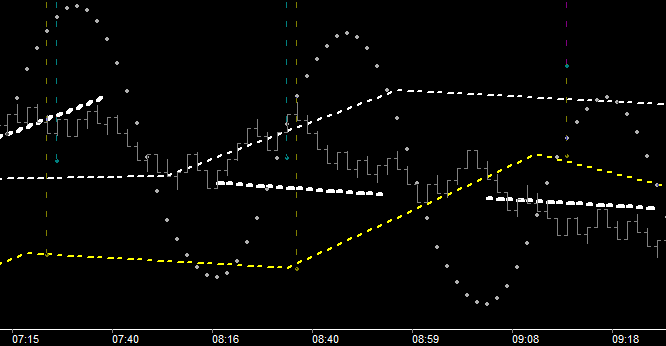
Where is price @ Time? That question needs further clarification, ie. Which Time? For our purposes here I'm going to demonstrate Time 21 (Tm21). The details of 'Why Tm21' will be found listed below and elsewhere in this help file.
When you initially looked at the 'lower hi' wave example presented in the 'Lower Hi' category above, you no doubt thought . . . "OK, but what comes 1st? . . . it's easy to see in hindsight . . . but is there a cause?" . . . and the answer is Yes. There is a reoccurring moment in time where price crosses the momentum wave. This moment in time is consistently found at ~Tm21. Why?
1.Market Vibrational Wavelength = 26 2.Crossing wave = Friction Point 3.Crest or Trough - Friction Point = 5 4.Wavelength - 5 = 21 or . . . 5.Crest to Trough = 13 (ie. Wavelength/2) 6.Trough to Crest = 13 (ie. Wavelength/2) 7.Crest to Friction = 8 8.Trough to Friction = 8 9.Crest to Crest Friction or Trough to Trough Friction = 21 (ie. 13 + 8)
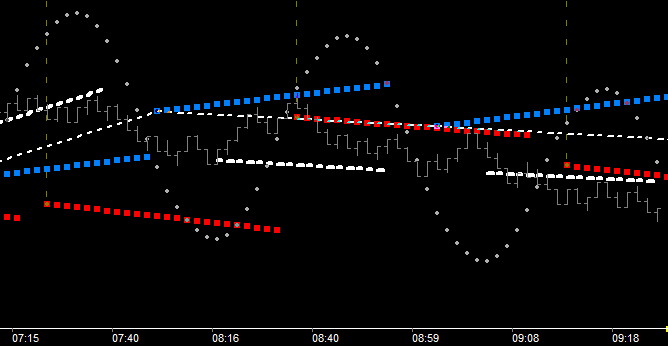
If price at this time (Tm21) cannot stay above the 'Friction Vector from Origin' (red), then a lower high is imminent. And lower high implies lower prices with confirmation being price staying below resistance level thresholds. Note that the friction vectors shown above are generated at origin (ie. 21 bars back) and show in the future, so it is easy to watch prices action as it applies into (approaches) Tm21.
The question then . . . Where is price @ Tm21?, becomes one of 'resistance vs. support' @ Tm21, (ie. Tm21 Threshold!). Threshold of 'Change vs. Continuance', and understanding that is the crux of successful trading.
Vibration itself would not exist if there were not two opposing forces in play at all times. These forces are generated from the above (Crest) and the below (Trough) undulation of the momentum wave and are described in further detail elsewhere in this help file. For now, understand that demonstrated in the pic above is the 'above' force, exerted from the prior wave crest. So the Tm21 shown thus far is Tm21Abv. What makes a Time Threshold significant is the combination of Sup/Res components present at Time. The operative word here is 'present'. Remember these Sup/Res components were generated at an earlier 'Time', and projected into the future. Price is there at time because that is what price does . . . it constantly moves to threshold because it is attracted to that decision state. That's why we are interested in price action as it 'applies' into threshold.
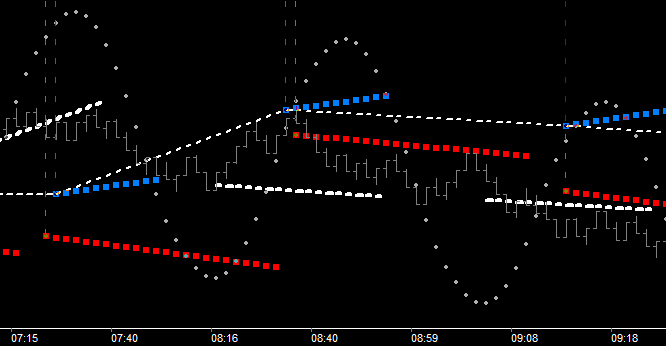
What's missing from our picture then is the Below Time, or Tm21Blw.
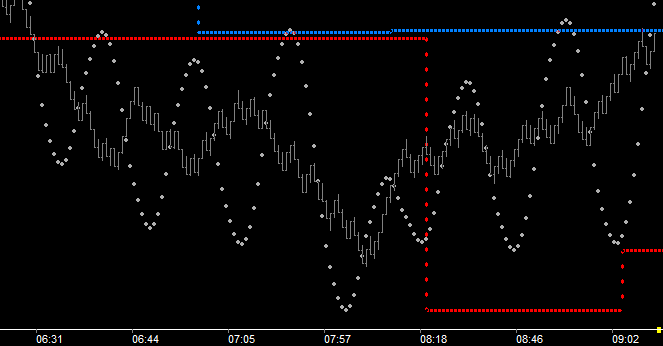
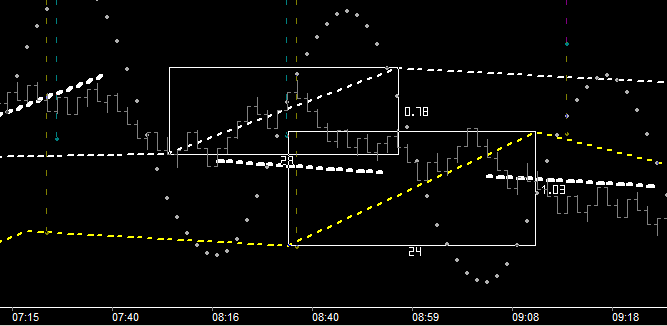
At ~8:35 one can see a significant threshold of Tm21Blw and Tm21Abv. That threshold was known ever since ~7:30 (Crest). It is fundamental to MTR that price is pretty likely to 'be there then', and as that time approaches the 'destiny of the rise in price' is confirmed. Specifically starting at the trough at ~8:16.
Which can be traded as a retracement trade with the white support shown. This is an important level and is only support until it is not. That white line is -5 (a Tm component) into the negative (or contra-momentum) space found below the trough P/T level, and represents a significant holding level 'IF' price is going to hold and rise (or spiral up) into the momentum which is now rising. Any move below is a stop and any upside to come (following a move below white) would have to prove itself by getting back above this white level. The question is . . . is there reason for rise here?, and the answer is yes . . . significant threshold exists at Tm21 (~8:35). From a trading perspective, Reward to Risk here is ~ 5 to 1. Knowing Rwd to Rsk is another essential to successful trading.
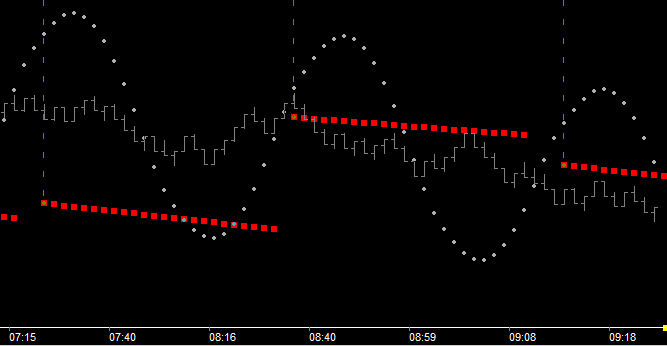
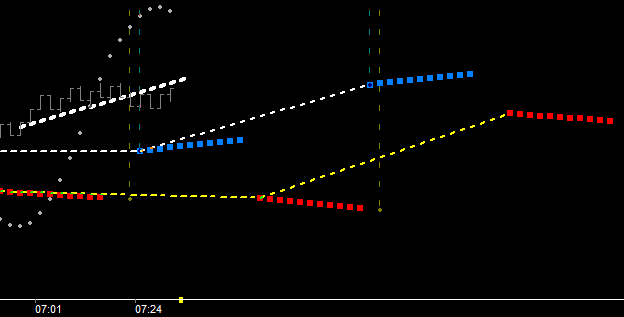
Spend some time now and study this chart. See how price dropped below white support level at previous Tm21Abv (~7:20). That's where the downside began. Notice price remained supported by the Tm21Blw vector until it dropped sharply as it approached the tunnel entrance between the two blue vectors. That tunneling confirmed the downside bias and invoked the 'retracement state' of any upside, unless price moves back above a blue friction vector, which did not happen. So you can have significant rise in a retracement move, usually to threshold as shown above, but it is still retracement until price tunnels back up. Notice also that the retracement to threshold moved price all the way to the actual breakdown level initiated at 7:20, in affect, a double top. This is also what MTR accomplishes. It demonstrates the cause and timing of common events such as this.
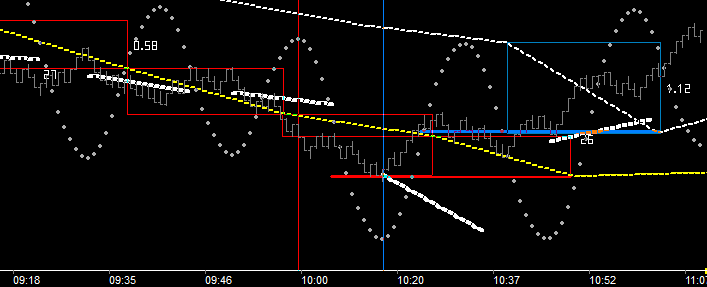
When I speak of tunneling I refer the event occurring at ~7:40 in the pic above. Picture a line running from the end of the lower blue vector to the beginning of the upper blue vector. That is the tunnel entrance to a 'neutral' state. As price is applying into this possible change of state (from 7:15 forward) the MTR trader knows this:
'IF' price is going to go higher here now:
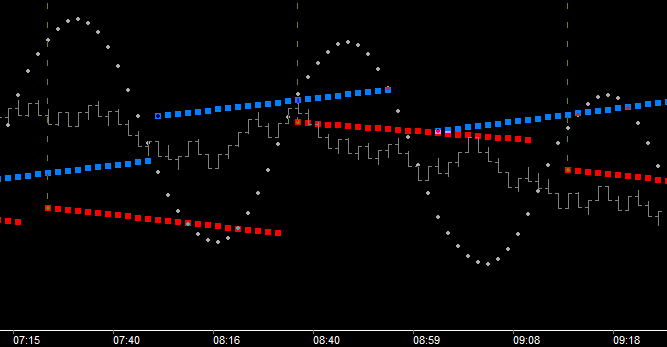
1.Price should not drop below white 2.Price should not drop below the higher blue vector being applied into (project it backwards visually This blue vector being shown in the future is because we are interested in what price is doing relative to this vector as it approaches the selected time. The vector exists since origin and can be shown from any point in time forward. Here we are demonstrating the significance of Tm21.) 3.Price needs to be above the higher blue vector when it gets there (ie. Tm21Blw) 4.Price must maintain position above the Tm21Blw 'Time Fence' (shown below as dashed white line)
Movement below this time line (fence) marks a change as depicted above and contributes significantly to the vibrational map projected in the future by Burton Cycle Tools.
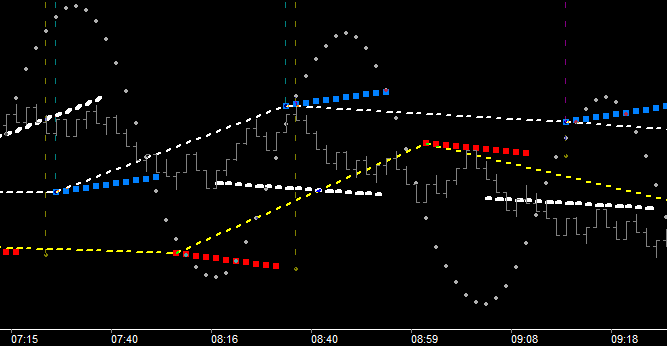
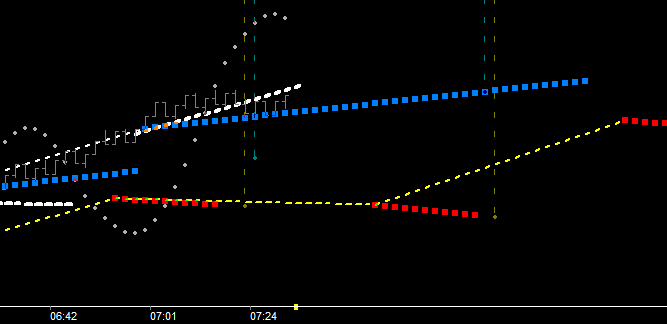
Because this is a 'Phi rich' vibrational map, it should follow that if Tm21 is a significant timing event (as described and demonstrated above) then . . . what about Tm34? Very very good question! And before proceeding with that, look at the above friction vector (blue ~7:55). From discussion thus far you know that's Tm21Blw, right? So count out from there, along the vector, 13 more counts (ie. 21, 22, 23, 24, etc, . . . 34). You should end up seeing that right at Tm21Abv (red ~8:35) is Tm34Blw. So . . . Tm34Blw = Tm21Abv, which is understood as, 'is approximately equal to'. And we can see this easily by changing our setting from Tm21Blw to Tm34Blw (shown below).
Tm34 is the most significant Time fence for many reasons, and consequently Tm34Abv should be equally as significant as shown below.
Tm34 is directional bias. Don't the 8 and 13 fences catch price changes earlier? . . . Yes they can, but in general they will be retracement related price movements. Depending on where the Tm34 is in relation. So follow Tm34 in your trading, especially well defined threshold opportunities as shown above.
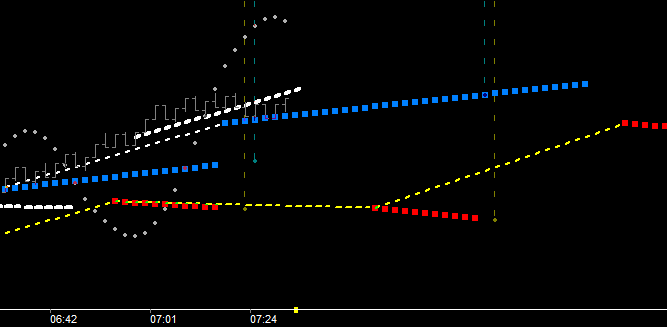
As a point of clarity here let's ask . . . What did we know when? After all, if the momentum wave structure is causational, time and price would be projected in advance. Remember, Burton Cycle Tools are creating a map of vibration that price is going to walk into and react to. Thus, the momentum wave is both self-generative and causational.
Above shows just after 7:24 (at the Crest) the future Tm34Abv (red) was known and Tm34Blw (blue) was known just before 7:01 (at the trough). Try to keep in mind that that these friction vectors exist from origin. So they are easily displayed from wherever you choose . . .
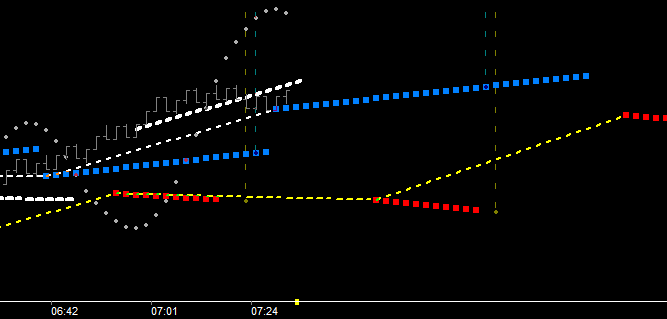
From origin for instance, (ie. zero). The vector is support of course (and should totally keep you from shorting the market while in this position), because Tm0 is Tm0 and the vector exists from Tm0. But the time fence which is marking the Time/Price angle from cycle to cycle is completely meaningless. A 'zero fence' doesn't even exist until after the fact.
From 8 for instance. The time fence only shows past its generation point which is at trough. A break below after generation is significant because of the tunneling effect discussed previously. (ie. If price tunnels Tm8 it has dropped into a tunnel entrance and must get back above for further upside to occur.
From 13 for instance. Same thought process as 8.
So while fences and timing points 8 and 13 are useful for staying with a trade and re-entry opportunities, Tm21 and Tm34 are considerably stronger components of change vs. continuation (ie. threshold), and thus merit both our attention and focus. As stated, this is because their timing is cross-referenced with timing of the opposing force.
|
Some of the concepts presented in the material above may be familiar . . . yet uniquely different. Most will be completely new to you and will require effort on your part. As you use and reuse this help file please remember that learning something new is an additive process, a step by step process. Learn one thing and then the next. To become proficient at any activity (be it work or hobby) requires study, practice, and observation. In this case we are talking about work. Yes, trading is a job and needs to be taken seriously. Can you be successful? . . . the answer is yes. However, in most cases there is much to overcome in the form of bad habits and emotion (ie. baggage).