October 10, 2024

Updates:

Saturday, Jan 26, 2013 . . . added YouTube links for all videos in both the ‘Help and Study Guide‘ and the ‘Law of Vibration‘ site.

Friday, Jan 11, 2013 . . . added Visitor Poll . . . ‘Favorite Markets’.

Saturday, Jan 5, 2013 . . . added Return Point mechanism dll ‘IRFmmXL to the Tool Downloads page

Saturday, Jan 5, 2013 . . . added gNomonic targeting dll ‘gBmprN’ to the Tool Downloads page

Friday, Jan 4, 2013 . . . added gNomonic targeting dll ‘gBmprP’ to the Tool Downloads page

Friday, Jan 4, 2013 . . . added New FAQ: ‘When does my trial period start?’

Friday, Jan 4, 2013 .  . added ‘News & Updates’ menu tab: ‘Blog’
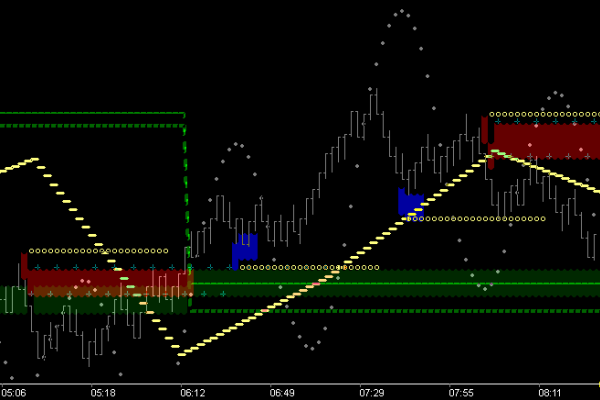
Chart Settings

Users and viewers are invited to check-out my Facebook page (law of vibration) where numerous favorite charts (with their parameter settings) are posted daily in real-time. These updates typically show both default settings as well as tweaks and combinations I like to use . . . including fractal size combinations.

Auto 45’s . . .

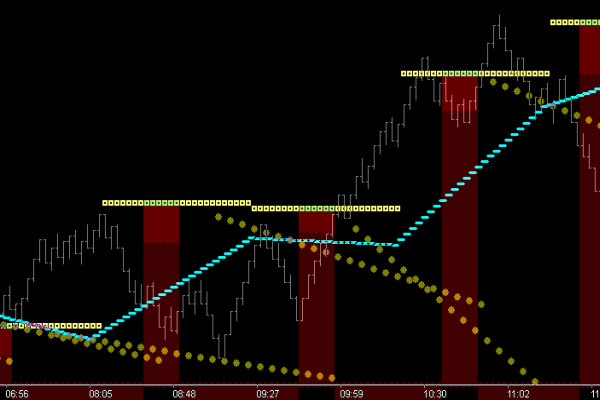
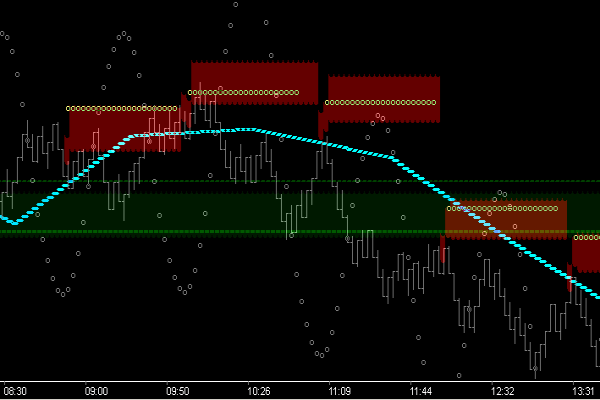
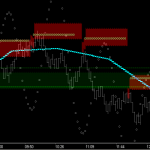
The 45 Time/Price levels (displayed as zones using the Auto Momentum Tape Reader tool), provide consistent price position feedback to the trader. Specifically . . . continuance vs bracketing versus break-out potential/time. The picture above is painted quite clearly as price applies into 1st: key Fib fence (vector) crossover potential, 5:18 forward, and 2nd: key trough resistance break-out potential, from fence crossing forward. This 2nd point is crucial to tape reading. The reason this potential resistance break will be key to break-out is because this price level was previously broken above. The green zone that is running parallel and below the current red zone tells you that earlier in the day, buying occurred at this price level . . . enough buying that a break-out above the red resistance level occurred, which consequently turned into this running support level . . . the green zone. This green zone then represents the last reversal support zone and is going to keep running until a new reversal support zone occurs . . . a new green. So as price applies into this red reversal potential the trader knows that this is a level where the market had support previously, and if a resistance break occurs here, a new support zone green will be generated, confirming that market support still exists at this price level, ie the perfect proof-point level. When/if this occurs, the 3rd marker (green lines) will drop to mark this significant event as a 270* support zone, and it will remain support until it is not. This pic should be studied thoroughly as it reveals the exact mechanism that successful tape reading is all about, ie natural law support/resistance levels broken become resistance/support levels of the future. Tracking those levels and trading accordingly, with stops as shown, places your trade entry on the correct side of market momentum.

Fib Level Targeting . . .

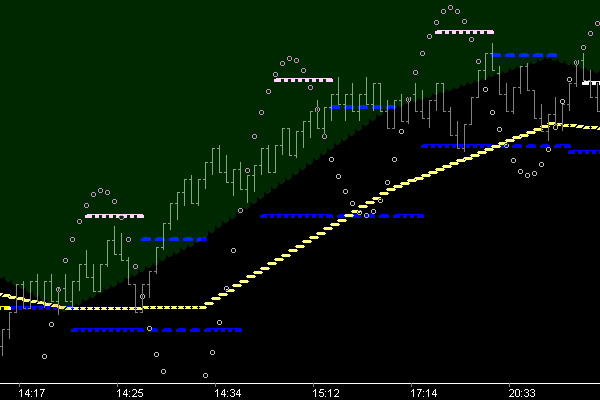
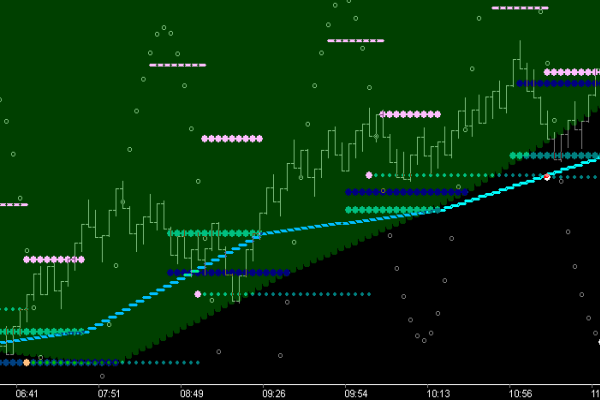
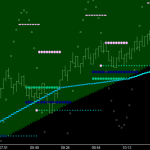
Price above key Fib Fence and key Fib Level is in a position to expand to the upside. As price steps through cycles, the Fib targeting levels will continue to be completed as long as price remains above the key Fib fence.  Setting an upper ‘Break-Out’ zone Fib fence to a colored zone can communicate clearly that price is advancing in an extreme break-out zone, ie higher hi’s, higher lo’s and the wave is rising.

Crest Thermometer Caps . . .

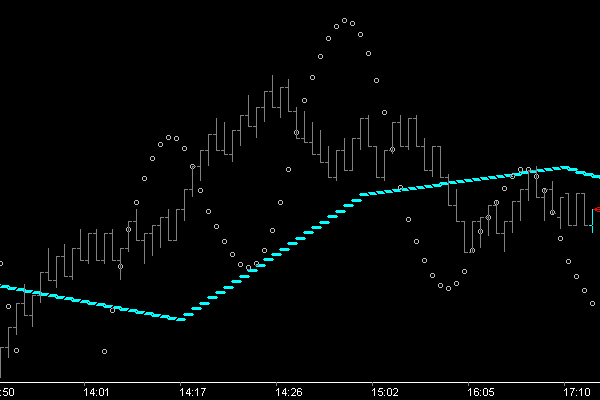
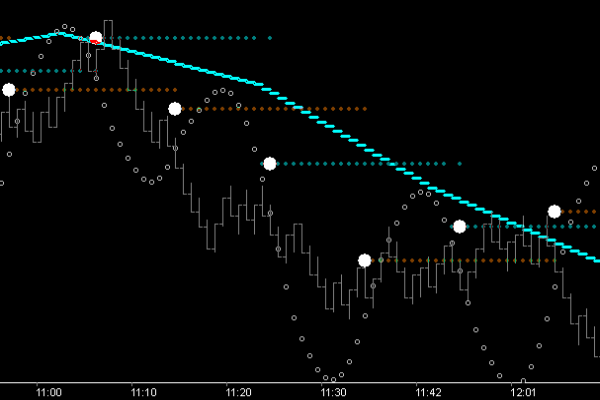
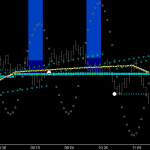
Crest Caps, Fib Vectors and the 21 Count are dominant forces even outside the realm of Fib Fence directional bias. Always ask yourself . . . What is price doing as it applies into the 21 count (right side of the thermometer). The cap level functions as a proof-point break-out level . . . so what is the relationship with other proof-point levels at 21 count time? (ie Fib Fence, Fib Levels, Vectors, Time Fence, etc.) Is price applying or consolidating into this cap level at time? Have upside targets been triggered? Is price at break-out approach above the previous cycle’s vectors? (brown dots) Understand that failure to break-out puts price in a position to get capped by the upcoming vector . . . which will appear at wave shock-point. So either it gets trapped, or it launches higher. Take advantage of that knowledge as set-ups occur repeatedly.

Time Price 45’s . . .

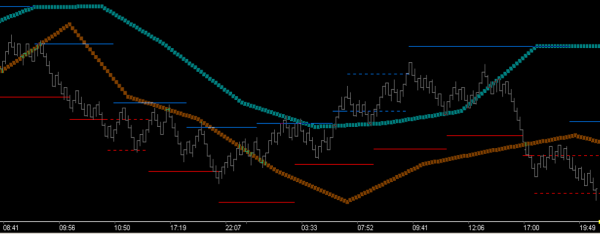
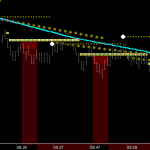
Crest and Trough Time/Price 45 Vectors (Time Fences) enhance the trader’s mental clarity/ability to take advantage of the inherent (Natural Law) momentum fundamentals of these levels. Knowledge of these levels, both vector and horizontal fold-over (the Price/Time Square point), gives understanding to the momentum up, momentum down, and bracketed position of price that ensues when these levels are crossed. This knowledge alone yields success in trading, as the trader learns to trade the follow through price action these zones provide. Relationship principles (confluence) of these vectors apply to any fractal (chart size) on any market, and should be included in any trade entry decision.

Burton Cycle Tools with this feature include:

MTR’s_U2, UT, AUTO, XOvr, Crest, Trough

Fib Vectors . . .

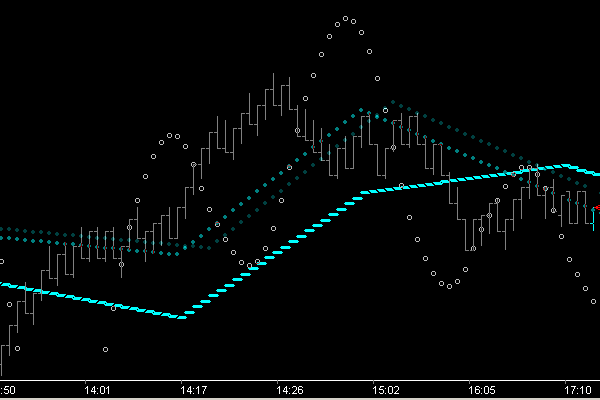
Fib Time/Price vectors (Fib Fences), both Trough and Crest, provide exceptional zones of opportunity and clarity to price’s position. The single best Fib Fence for study and trading is the trough Fib17_Tm21. Daily observation of price action when key fences like this are crossed will facilitate your trading for Fib targeting on the correct side of market momentum. Relationship principles (confluence) of these vectors apply to any fractal (chart size) on any market, and should be included in any trade entry decision.

Adding trough Time/Price vectors (Fences) Time/Price 13 and Time/Price 17 will further clarify momentum breakout levels and price cap levels. Price dropping below trough fences invokes clear proof-point logic, ie shows what resistance (cap) price has to overcome to continue higher.

Momentum Caps/Cups . . .

Momentum Caps/Cups show the shock-point resistance/support levels of the wave. Directional filtering provided by a primary Fib fence provides clarity to price action, both at shock-point time and as price retraces into these momentum price levels. Confluence of these Momentum levels, Fib fence (vectors), and Time fence (vectors) provides clear proof-point logic for trade entry and stop.

Utilities: MTR

The MTR_UT dll functions as a wave support dll providing a fast and complete source for many structural components to be displayed as desired. It also can easily function as a stand alone trade environment, painting a clear picture of what state price is in. Because of this, it is a good source dll to play with and study as you get familiar with Fib Fences, Fib Levels & Targeting, Fold-Over Levels, Fib GateWay Break-Outs, Tm Fences, and Pr/Tm Target Vectoring & FishTails (Lead-Ins).

Wave Mechanism: When the rising mLkAhd of the trough turn exceeds price (the trough shock-point), the Fib_0 level is displayed as resistance/target zone across the Crest phase of the wave. When the falling mLkAhd of the crest turn exceeds price (the crest shock-point), the Fib_0 level is displayed as support/target zone across the Trough phase of the wave.

Fib Fence Mechanism: The momentum shock-points create LkAhd differential vectoring, thus generating a Fib structure in terms of both price and time. Marking FibLv13@Tm21 from one cycle to the next creates a vector (or Fib Fence) that tracks whether the FibLv13 is rising or falling, and shows whether price is above or below this fence. The opening in the fence marks the rotation point (ie Tm21, ie the PrTm anchor point) for the projection of the fence in the next cycle. Essentially this ‘Fold-Over’ level is the base of a Fib-Square, and can be shown.

Fib_8 Targeting: Part of the self-generating aspect of the wave is that price is consistently finding its way to the Fib_8 level of the opposing forces. Note: Because of this, targeting these levels works exceptionally well when your directional bias criteria is met. Both Fib Fences and Fib Fold-Over Levels can be constructed to provide max reward/min risk opportunities as demonstrated in these charts.

Fib GateWay Break-Outs: Price moving beyond the Fib_8, Fib_5, Fib_0 level, is breaking out to higher or lower targeting, but you need entry. Fib Fences can be used to highlight or define this break-out zone in a variety of ways.

Tm Fences (from trough/crest friction vectors): Any combination of standard Tm fences can be output using this dll. Much has been written elsewhere regarding standard structures such as 13,17; 17,21; 21,26; 26,34; etc, and trough vs crest.

Pr/Tm Target Vectoring & FishTails:  Since price has an extreme predilection to accomplish the Fib_8 levels, it should follow that a vectoring mechanism should exist that points a path to that level. We also know that the fold-over level of fences are essentially the Base and Top of Squares. So . . . might it not be useful to project form that ‘horizontal’ (base/top level) towards the target level at some ‘relevant’ time point, say . . . 72, 81, or 90. Doing that can provide a unique perspective as price applies into a change point, ie helping you read the story of price action.

Auto: MTR

The MTR_AUTO dll displays resistance and support zones of the market at each wave turn. Directional Bias output is selectable by user, using any Price/Time Fib Fence desired.

Trough Mechanism: When broken, the resistance zone becomes support. These reversal zone bandwidths consistently define the bracketing levels of future price action, setting the stage for clearly defined retracements to breakout levels.

Crest Mechanism: When broken, the support zone becomes resistance. A market (as pictured) that is merely retracing into prior support reversal zones, is trending down.